ENGR.ECONOMIC ANALYSIS
14th Edition
ISBN: 9780190931919
Author: NEWNAN
Publisher: Oxford University Press
expand_more
expand_more
format_list_bulleted
Question

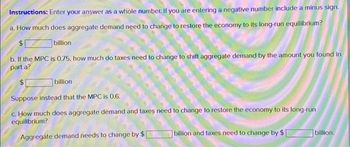
Transcribed Image Text:Instructions: Enter your answer as a whole number. If you are entering a negative number include a minus sign.
a. How much does aggregate demand need to change to restore the economy to its long-run equilibrium?
billion
b. If the MPC is 0.75, how much do taxes need to change to shift aggregate demand by the amount you found in
part a?
$1
billion
Suppose instead that the MPC is 0.6.
c. How much does aggregate demand and taxes need to change to restore the economy to its long-run
equilibrium?
Aggregate demand needs to change by $
billion and taxes need to change by $1
billion.

Transcribed Image Text:7
ts
eBook
ferences
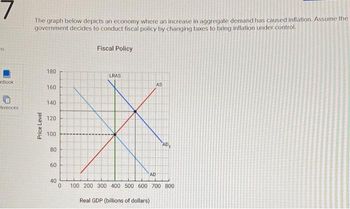
The graph below depicts an economy where an increase in aggregate demand has caused inflation. Assume the
government decides to conduct fiscal policy by changing taxes to bring inflation under control.
Price Level
180
160
140
120
100
80
60
40
0
Fiscal Policy
LRAS
AD
AS
AD₁
100 200 300 400 500 600 700 800
Real GDP (billions of dollars)
Expert Solution
This question has been solved!
Explore an expertly crafted, step-by-step solution for a thorough understanding of key concepts.
Step by stepSolved in 5 steps with 5 images

Knowledge Booster
Learn more about
Need a deep-dive on the concept behind this application? Look no further. Learn more about this topic, economics and related others by exploring similar questions and additional content below.Similar questions
- Look at Figure 2. Assume this aggregate demand diagram represents an economy with government, where: a = exogenous consumption b = the marginal propensity to consume t = the tax rate |= investment G = government spending Y = income Figure 2 Aggregate demand AD, AD. 45° Income What is the equation for the aggregate demand schedule ADo? Select one: O ADO = b+ a(1 - t)G +1+ Y O ADO = a + b(1 – 1)Y + 1+ G O ADO = a + b(1 - t) I+ Y+ G O ADO = b+ a(1 – 1)Y + /+ G Next page > ( Previous page PHILIPSarrow_forwardPrice Level p* a LRAS Y* AD Real GDP AS Tools Fiscal Action 0 a. How does the short-run equilibrium compare to the initial equilibrium? The price level has (Click to select) and output has [(Click to select) b. What is the primary concern of policy makers under these conditions? high unemployment O declining value of the dollar O high Inflation V c. What policy action might the government take in order to improve economic conditions? (Click to select) fiscal policy by [(Click to select) taxes and/or (Click to select)government purchases d. Use the graph above to depict the goal of the fiscal action discussed Instructions: Use the tool provided 'Fiscal Action' to show the result of the policy action taken by the government. Plot only the endpoints of the line (2 points total). Label your line appropriately. e. What is the desired final outcome after the fiscal policy action and multiplier effect have occurred? A price level [(Click to select) P* and an output level [(Click to select) Y*…arrow_forwardThe aggregate demand function: yad =C+1+G₁ = 500+ 0.75Y is plotted on the graph to the right. The graph also shows the 45° line where aggregate output Y equals aggregate demand yad for all points. What happens to aggregate output if government spending rises by 100? The equilibrium level of output rises by $ billion. (Round your response to the nearest billion.) Consumption Expenditure, C ($ billions) 3000- 2800- 2600- 2400- 2200- 2000- 1800- 1600- 1400- 1200- 1000- 800- 600- 400- 200- 0- 0 yad =C+I+G₁ = 500 +0.75Y Y = yad 45° 400 800 1200 1600 2000 2400 2800 Disposable Income ($ billions)arrow_forward
- Suppose the economy begins at full employment. Label this starting point as point "1." Then, suppose that a long strike by coal miners reduces the coal supply and increases the price of coal. Show the effects on your graph and label the new equilibrium point "2." Lastly, suppose our government wants the economy to return to full-employment as quickly as possible. Should the government intervene? If so, show the impact of successful fiscal policy on your graph. Label this new equilibrium point "3."arrow_forwardA. Assume that a hypothetical economy with an MPC of .75 is experiencing severe recession. By how much would government spending have to rise to shift the aggregate demand curve rightward by $70 billion? B. How large a tax cut would be needed to achieve the same increase in aggregate demand?arrow_forwardDraw an AS-AD model of an economy dealing with an inflationary gap. What is one fiscal policy that can be implemented to close this gap? Draw the effect of that policy. Explain how the model returns to long run equilibrium if the government does not intervene.arrow_forward
- Assume that a hypothetical economy with an MPC of 0.75 is experiencing severe recession. Instructions: In part a, round your answers to 2 decimal places. Enter positive numbers. In part b, enter your answers as whole numbers. a. By how much would government spending have to rise to shift the aggregate demand curve rightward by $40 billion? $ billion. How large a tax cut would be needed to achieve the same increase in aggregate demand? $ billion. b. Determine one possible combination of government spending increases and tax increases that would accomplish the same goal without changing the amount of outstanding debt (because it maintains a balanced budget, G = T). Increase spending by $ billion. Increase taxes by $ billion.arrow_forwardPlease Answer the question with the step thank uarrow_forwardIn Paynia the marginal propensity to consume is .6. Times are tough and the economy is operating on the flat ("Keynesian") range of the Aggregate Supply Curve. If Congress wished to increase Aggregate Demand by $500 B, how much would it need to raise Government Spending, all else constant?arrow_forward
- Suppose actual real GDP is $7.87 trillion, potential real GDP is $14.36 trillion, and the marginal propensity to consume is 0.61. If we ignore price effects, by how many trillions of dollars should the government change its lump sum taxes to fix the gap? (Round this to two digits after the decimal and enter this value as either a positive value or a negative value without the dollar sign.)arrow_forwardSuppose actual real GDP is $9.06 trillion, potential real GDP is $6.42 trillion, and the marginal propensity to consume is 0.59. If we ignore price effects, by how many trillions of dollars should the government change its lump sum taxes to fix the gap? (Round this to two digits after the decimal and enter this value as either a positive value or a negative value without the dollar sign.)arrow_forwardIf Investment = f(r*) a. Explain with pictures how it affects the balance of Supply/Saving and Investment Demand in the event of Fiscal policy, namely by decreasing state spending and increasing taxes. b. Explain with pictures how it affects the balance of Supply/Saving and Investment Demand in the event of Fiscal policy, namely by decreasing state spending and increasing taxes if it happens overseasarrow_forward
arrow_back_ios
SEE MORE QUESTIONS
arrow_forward_ios
Recommended textbooks for you

 Principles of Economics (12th Edition)EconomicsISBN:9780134078779Author:Karl E. Case, Ray C. Fair, Sharon E. OsterPublisher:PEARSON
 Engineering Economy (17th Edition)EconomicsISBN:9780134870069Author:William G. Sullivan, Elin M. Wicks, C. Patrick KoellingPublisher:PEARSON
 Principles of Economics (MindTap Course List)EconomicsISBN:9781305585126Author:N. Gregory MankiwPublisher:Cengage Learning
 Managerial Economics: A Problem Solving ApproachEconomicsISBN:9781337106665Author:Luke M. Froeb, Brian T. McCann, Michael R. Ward, Mike ShorPublisher:Cengage Learning
 Managerial Economics & Business Strategy (Mcgraw-...EconomicsISBN:9781259290619Author:Michael Baye, Jeff PrincePublisher:McGraw-Hill Education


Principles of Economics (12th Edition)
Economics
ISBN:9780134078779
Author:Karl E. Case, Ray C. Fair, Sharon E. Oster
Publisher:PEARSON

Engineering Economy (17th Edition)
Economics
ISBN:9780134870069
Author:William G. Sullivan, Elin M. Wicks, C. Patrick Koelling
Publisher:PEARSON

Principles of Economics (MindTap Course List)
Economics
ISBN:9781305585126
Author:N. Gregory Mankiw
Publisher:Cengage Learning

Managerial Economics: A Problem Solving Approach
Economics
ISBN:9781337106665
Author:Luke M. Froeb, Brian T. McCann, Michael R. Ward, Mike Shor
Publisher:Cengage Learning

Managerial Economics & Business Strategy (Mcgraw-...
Economics
ISBN:9781259290619
Author:Michael Baye, Jeff Prince
Publisher:McGraw-Hill Education