MATLAB: An Introduction with Applications
6th Edition
ISBN: 9781119256830
Author: Amos Gilat
Publisher: John Wiley & Sons Inc
expand_more
expand_more
format_list_bulleted
Question
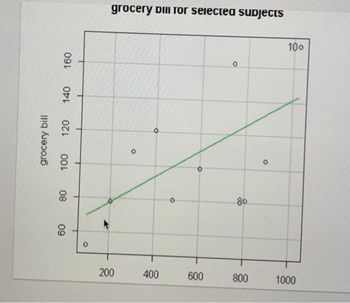
An economist conducted a study of the possible association between weekly income and weekly grocery expenditures. The
particular interest was whether higher income would result in shoppers spending more on groceries, A random sample of
shoppers at a local supermarket was obtained, and a questionnaire was administered asking about the weekly income of the
shopper's family and the grocery bill for that week. The gender of the shopper was also obtained. The graph below
contains a scatterplot with a least-squares line.

Transcribed Image Text:grocery bill
160
140
120
100
80
60
O
*
grocery Dill Tor selected subjects
200
O
O
400
600
80
800
10⁰
1000

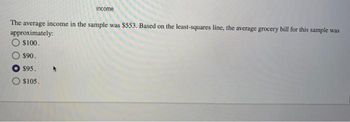
Transcribed Image Text:income
The average income in the sample was $553. Based on the least-squares line, the average grocery bill for this sample was
approximately:
O $100.
$90.
$95.
$105.
Expert Solution
This question has been solved!
Explore an expertly crafted, step-by-step solution for a thorough understanding of key concepts.
This is a popular solution
Trending nowThis is a popular solution!
Step by stepSolved in 3 steps

Knowledge Booster
Similar questions
- The maximum discount value of the Entertainment® card for the "Fine Dining" section for various pages is given in the table below. Page number Maximum value ($) 4 17 14 18 25 16 32 18 43 18 57 15 72 16 85 14 90 18 Let page number be the independent variable and maximum value be the dependent variable. Part (a) Draw a scatter plot of the ordered pairs. Part (b) Calculate the least-squares line. Put the equation in the form of: ŷ = a + bx. (Round your answers to three decimal places.) ŷ = ________ + __________ x Part (c) Find the correlation coefficient. (Round your answer to four decimal places.) r = Is it significant? (Use a significance level of 0.05.) Yes No Part (d) Find the estimated maximum values for the restaurants on page ten and on page 70. (Round your answers to the nearest cent.) Page 10: $ ____________ Page 70: $ ____________ Part (e) Does it appear that the restaurants giving the…arrow_forwardA data set is given below. (a) Draw a scatter diagram. Comment on the type of relation that appears to exist between x and y. (b) Given that x= 3.6667, sy = 2.2509, y= 3.6833, s, = 1.8809, and r= - 0.9511, determine the least-squares regression line. (c) Graph the least-squares regression line on the scatter diagram drawn in part (a). 1 4 4 6 6 y 5.0 6.3 4.2 3.4 1.4 1.8 (a) Choose the correct graph below. OA. B. OC. OD. Ay 74 Ay Ay 7- .. .. There appears to be a linear, negative relationship. (b) y=x+ O (Round to three decimal places as needed.) (c) Choose the correct graph below. O A. B. OC. D. Ay 0-arrow_forwardA data set is given below. (a) Draw a scatter diagram. Comment on the type of relation that appears to exist between x and y (b) Given that x =3.5000, s, = 2.2583, y = 4.4667, s, = 1.7682, and r= -0.9416, determine the least-squares regression line. (c) Graph the least-squares regression line on the scatter diagram drawn in part (a). 6 3 4 5.4 68 5.6 4.0 2.3 2.7 1 y (a) Choose the correct graph below. O A Oc. Q There appears to be V relationship (b) y=+ O (Round to three decimal places as needed.) (c) Choose the correct graph below. O A OB. OC. OD.arrow_forward
- Which of the following individuals is likely to be excluded from a clinical trial? An individual with other diseases besides the disease of interest. An individual whose data is considered to be an outlier. An individual of who is considered to be a minority. An individual who will have difficulty complying trial protocols. bartleby expert answers x2 is D (an individual who will have difficulty complying trial protocols); however, other online resources are consistently indicating A is actually the correct answer (an individual with other diseases besides the disease of interest)...which is the correct answer and why? thanksarrow_forwardcar manufacturer is concerned about poor customer satisfaction at one of its dealerships. The management decides to evaluate the satisfaction surveys of its next 60 customers. The dealership will be fined if the number of customers who report favorably is between 42 and 49. The dealership will be dissolved if fewer than 42 customers report favorably. It is known that 72% of the dealership’s customers report favorably on satisfaction surveys. [You may find it useful to reference the z table.] a. What is the probability that the dealership will be fined? (Round final answer to 4 decimal places.) b. What is the probability that the dealership will be dissolved? (Round final answer to 4 decimal places.)arrow_forwardCollege Graduation Rates. Data from the College Results Online website compared the 2011 graduation rate and median SAT score for 92 similar-sized public universities and colleges in the United States. The scatterplot below shows the relationship between these two variables along with the least squares fit. Round all calculated results to 4 decimal places. I ONLY need help with question 6.arrow_forward
arrow_back_ios
arrow_forward_ios
Recommended textbooks for you
 MATLAB: An Introduction with ApplicationsStatisticsISBN:9781119256830Author:Amos GilatPublisher:John Wiley & Sons Inc
 Probability and Statistics for Engineering and th...StatisticsISBN:9781305251809Author:Jay L. DevorePublisher:Cengage Learning
 Statistics for The Behavioral Sciences (MindTap C...StatisticsISBN:9781305504912Author:Frederick J Gravetter, Larry B. WallnauPublisher:Cengage Learning
 Elementary Statistics: Picturing the World (7th E...StatisticsISBN:9780134683416Author:Ron Larson, Betsy FarberPublisher:PEARSON
 The Basic Practice of StatisticsStatisticsISBN:9781319042578Author:David S. Moore, William I. Notz, Michael A. FlignerPublisher:W. H. Freeman
 Introduction to the Practice of StatisticsStatisticsISBN:9781319013387Author:David S. Moore, George P. McCabe, Bruce A. CraigPublisher:W. H. Freeman

MATLAB: An Introduction with Applications
Statistics
ISBN:9781119256830
Author:Amos Gilat
Publisher:John Wiley & Sons Inc

Probability and Statistics for Engineering and th...
Statistics
ISBN:9781305251809
Author:Jay L. Devore
Publisher:Cengage Learning

Statistics for The Behavioral Sciences (MindTap C...
Statistics
ISBN:9781305504912
Author:Frederick J Gravetter, Larry B. Wallnau
Publisher:Cengage Learning

Elementary Statistics: Picturing the World (7th E...
Statistics
ISBN:9780134683416
Author:Ron Larson, Betsy Farber
Publisher:PEARSON

The Basic Practice of Statistics
Statistics
ISBN:9781319042578
Author:David S. Moore, William I. Notz, Michael A. Fligner
Publisher:W. H. Freeman

Introduction to the Practice of Statistics
Statistics
ISBN:9781319013387
Author:David S. Moore, George P. McCabe, Bruce A. Craig
Publisher:W. H. Freeman