MATLAB: An Introduction with Applications
6th Edition
ISBN: 9781119256830
Author: Amos Gilat
Publisher: John Wiley & Sons Inc
expand_more
expand_more
format_list_bulleted
Question
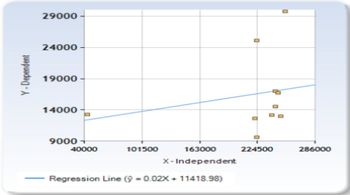
1) -Describe the association between College Tuition and
-Identify and interpret the y-intercept and slope of your least squares regression line
-Identify and interpret your coefficient of determination

Transcribed Image Text:Y-Dependent
29000
24000
19000
14000
9000 +
40000
101500
163000
X-Independent
Regression Line (ŷ = 0.02X+11418.98)
0
224500
286000

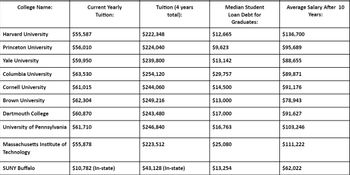
Transcribed Image Text:College Name:
Harvard University
Princeton University
Yale University
Current Yearly
Tuition:
$55,587
$56,010
$59,950
Columbia University
$63,530
Cornell University
$61,015
Brown University
$62,304
Dartmouth College
$60,870
University of Pennsylvania $61,710
SUNY Buffalo
Massachusetts Institute of $55,878
Technology
$10,782 (In-state)
Tuition (4 years
total):
$222,348
$224,040
$239,800
$254,120
$244,060
$249,216
$243,480
$246,840
$223,512
$43,128 (In-state)
Median Student
Loan Debt for
Graduates:
$12,665
$9,623
$13,142
$29,757
$14,500
$13,000
$17,000
$16,763
$25,080
$13,254
Average Salary After 10
Years:
$136,700
$95,689
$88,655
$89,871
$91,176
$78,943
$91,627
$103,246
$111,222
$62,022
Expert Solution
This question has been solved!
Explore an expertly crafted, step-by-step solution for a thorough understanding of key concepts.
Step by stepSolved in 3 steps with 1 images

Knowledge Booster
Similar questions
- We expect a car's highway gas mileage to be related to its city gas mileage (in miles per gallon, mpg). Data for all 1259 vehicles in the government's 2019 Fuel Economy Guide give the regression line highway mpg = 8.720 + (0.914x city mpg) for predicting highway mileage from city mileage. 1 O Macmillan Learning (b) What is the intercept? Give your answer to three decimal places. intercept: Why is the value of the intercept not statistically meaningful? The value of the intercept is an average value calculated from a sample. The value of the intercept represents the predicted highway mileage for city gas mileage of 0 mpg, and such a prediction would be invalid since 0 is outside the range of the data. The value of the intercept represents the predicted highway mileage for slope 0. O The value of the intercept represents the predicted city mileage for highway gas mileage of 0 mpg, and such a car does not exist. mpgarrow_forwardThe consumption function captures one of the key relationships in economics. It expresses consumption as a function of disposal income, where disposable income is income after taxes. The attached file "Regression-Dataset1" shows data of average US annual consumption (in $) and disposable income (in $) for the years 2000 to 2016. a)what is the Pearson correlation value between income and consumption? Select one: Ⓒa. 0.978 b. 0.109 c. None of the above d. 0.791arrow_forwardCompute the least-squares regression line for predicting the right foot temperature from the left foot temperature. Round the slope and y-Intercept values to four decimal places.arrow_forward
- Can you help me to answer this using R code?arrow_forwardDevelop a scatterplot and explore the correlation between customer age and net sales by each type of customer (regular/promotion). Use the horizontal axis for the customer age to graph. Find the linear regression line that models the data by each type of customer. Round the rate of changes (slopes) to two decimal places and interpret them in terms of the relation between the change in age and the change in net sales. What can you conclude? Hint: Rate of Change = Vertical Change / Horizontal Change = Change in y / Change in xarrow_forwardWe have data from 209 publicly traded companies (circa 2010) indicating sales and compensation information at the firm-level. We are interested in predicting a company's sales based on the CEO's salary. The variable sales; represents firm i's annual sales in millions of dollars. The variable salary; represents the salary of a firm i's CEO in thousands of dollars. We use least-squares to estimate the linear regression sales; = a + ßsalary; + ei and get the following regression results: . regress sales salary Source Model Residual Total sales salary cons SS 337920405 2.3180e+10 2.3518e+10 df 1 207 208 Coef. Std. Err. .9287785 .5346574 5733.917 1002.477 MS 337920405 111980203 113066454 Number of obs F (1, 207) Prob > F R-squared t P>|t| = Adj R-squared = Root MSE 1.74 0.084 5.72 0.000 = = -.1252934 3757.543 = 209 3.02 0.0838 0.0144 0.0096 10582 [95% Conf. Interval] 1.98285 7710.291 This output tells us the regression line equation is sales = 5,733.917 +0.9287785 salary. Interpret the…arrow_forward
arrow_back_ios
arrow_forward_ios
Recommended textbooks for you
 MATLAB: An Introduction with ApplicationsStatisticsISBN:9781119256830Author:Amos GilatPublisher:John Wiley & Sons Inc
 Probability and Statistics for Engineering and th...StatisticsISBN:9781305251809Author:Jay L. DevorePublisher:Cengage Learning
 Statistics for The Behavioral Sciences (MindTap C...StatisticsISBN:9781305504912Author:Frederick J Gravetter, Larry B. WallnauPublisher:Cengage Learning
 Elementary Statistics: Picturing the World (7th E...StatisticsISBN:9780134683416Author:Ron Larson, Betsy FarberPublisher:PEARSON
 The Basic Practice of StatisticsStatisticsISBN:9781319042578Author:David S. Moore, William I. Notz, Michael A. FlignerPublisher:W. H. Freeman
 Introduction to the Practice of StatisticsStatisticsISBN:9781319013387Author:David S. Moore, George P. McCabe, Bruce A. CraigPublisher:W. H. Freeman

MATLAB: An Introduction with Applications
Statistics
ISBN:9781119256830
Author:Amos Gilat
Publisher:John Wiley & Sons Inc

Probability and Statistics for Engineering and th...
Statistics
ISBN:9781305251809
Author:Jay L. Devore
Publisher:Cengage Learning

Statistics for The Behavioral Sciences (MindTap C...
Statistics
ISBN:9781305504912
Author:Frederick J Gravetter, Larry B. Wallnau
Publisher:Cengage Learning

Elementary Statistics: Picturing the World (7th E...
Statistics
ISBN:9780134683416
Author:Ron Larson, Betsy Farber
Publisher:PEARSON

The Basic Practice of Statistics
Statistics
ISBN:9781319042578
Author:David S. Moore, William I. Notz, Michael A. Fligner
Publisher:W. H. Freeman

Introduction to the Practice of Statistics
Statistics
ISBN:9781319013387
Author:David S. Moore, George P. McCabe, Bruce A. Craig
Publisher:W. H. Freeman