In the short run, the quantity of output supplied by firms can deviate from the natural level of output if the actual price level deviates from the expected price level in the economy. A number of theories explain reasons why this might happen. For example, the sticky-wage theory asserts that output prices adjust more quickly to changes in the price level than wages do, in part beca long-term wage contracts. Suppose a firm signs a contract agreeing to pay its workers $15 per hour for the next year, based on an expected pr level of 100. If the actual price level turns out to be 110, the firm's output prices will and the wages the firm pays its worke remain fixed at the contracted level. The firm will respond to the unexpected increase in the price level by supplies. If many firms face similarly rigid wage contracts, the unexpected increase in the price level causes the quantity of output supplied to the natural level of output in the short run. the quantity of outpu Suppose the economy's short-run aggregate supply (AS) curve is given by the following equation: Quantity of Output Supplied = Natural Level of Output + ax (Price Level Actual-Price Level Expected) The Greek lettera represents a number that determines how much output responds to unexpected changes in the price level. In this case, ass that a = $4 billion. That is, when the actual price level exceeds the expected price level by 1, the quantity of output supplied will exceed the level of output by $4 billion. Suppose the natural level of output is $40 billion of real GDP and that people expect a price level of 110. On the following graph, use the purple line (diamond symbol) to plot this economy's long-run aggregate supply (LRAS) curve. Then use the or
In the short run, the quantity of output supplied by firms can deviate from the natural level of output if the actual price level deviates from the expected price level in the economy. A number of theories explain reasons why this might happen. For example, the sticky-wage theory asserts that output prices adjust more quickly to changes in the price level than wages do, in part beca long-term wage contracts. Suppose a firm signs a contract agreeing to pay its workers $15 per hour for the next year, based on an expected pr level of 100. If the actual price level turns out to be 110, the firm's output prices will and the wages the firm pays its worke remain fixed at the contracted level. The firm will respond to the unexpected increase in the price level by supplies. If many firms face similarly rigid wage contracts, the unexpected increase in the price level causes the quantity of output supplied to the natural level of output in the short run. the quantity of outpu Suppose the economy's short-run aggregate supply (AS) curve is given by the following equation: Quantity of Output Supplied = Natural Level of Output + ax (Price Level Actual-Price Level Expected) The Greek lettera represents a number that determines how much output responds to unexpected changes in the price level. In this case, ass that a = $4 billion. That is, when the actual price level exceeds the expected price level by 1, the quantity of output supplied will exceed the level of output by $4 billion. Suppose the natural level of output is $40 billion of real GDP and that people expect a price level of 110. On the following graph, use the purple line (diamond symbol) to plot this economy's long-run aggregate supply (LRAS) curve. Then use the or

Chapter14: Aggregate Demand And Supply
Section14.A: The Self Correcting Aggregate Demand And Supply Model
Problem 6SQ

Related questions
Question
Transcribed Image Text:In the short run, the quantity of output supplied by firms can deviate from the natural level of output if the actual price level deviates from the
expected price level in the economy. A number of theories explain reasons why this might happen.
For example, the sticky-wage theory asserts that output prices adjust more quickly to changes in the price level than wages do, in part because of
long-term wage contracts. Suppose a firm signs a contract agreeing to pay its workers $15 per hour for the next year, based on an expected price
level of 100. If the actual price level turns out to be 110, the firm's output prices will
and the wages the firm pays its workers will
remain fixed at the contracted level. The firm will respond to the unexpected increase in the price level by
the quantity of output it
supplies. If many firms face similarly rigid wage contracts, the unexpected increase in the price level causes the quantity of output supplied to
the natural level of output in the short run.
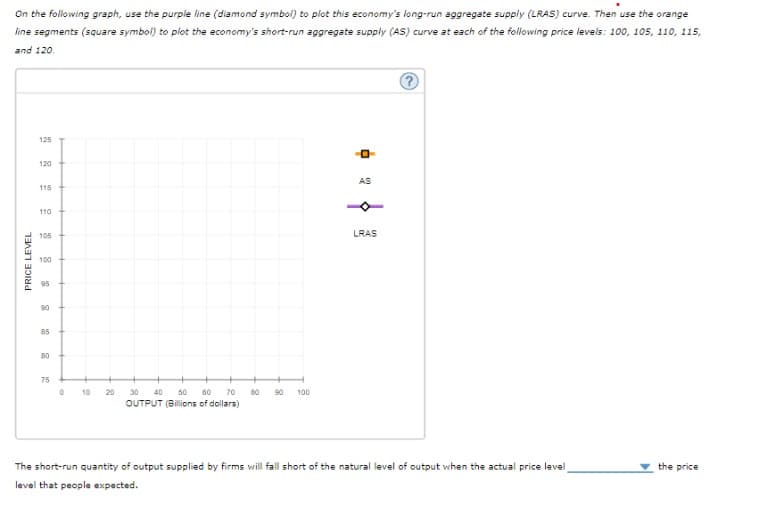
Suppose the economy's short-run aggregate supply (AS) curve is given by the following equation:
Quantity of Output Supplied Natural Level of Output + ax (Price Level Actual-Price Level Expected)
The Greek letter a represents a number that determines how much output responds to unexpected changes in the price level. In this case, assume
that a = $4 billion. That is, when the actual price level exceeds the expected price level by 1, the quantity of output supplied will exceed the natural
level of output by $4 billion.
Suppose the natural level of output is $40 billion of real GDP and that people expect a price level of 110.
On the following graph, use the purple line (diamond symbol) to plot this economy's long-run aggregate supply (LRAS) curve. Then use the orange
line segments (square symbol) to plot the economy's short-run aggregate supply (AS) curve at each of the following price levels: 100, 105, 110, 115,
and 120.
Transcribed Image Text:On the following graph, use the purple line (diamond symbol) to plot this economy's long-run aggregate supply (LRAS) curve. Then use the orange
line segments (square symbol) to plot the economy's short-run aggregate supply (AS) curve at each of the following price levels: 100, 105, 110, 115,
and 120.
PRICE LEVEL
125
120
115 +
110
105
100
95
90
85
80
75
0
10
20
30 40 50 60 70
OUTPUT (Billions of dollars)
80 90 100
0
AS
LRAS
?
The short-run quantity of output supplied by firms will fall short of the natural level of output when the actual price level
level that people expected.
the price
Expert Solution
This question has been solved!
Explore an expertly crafted, step-by-step solution for a thorough understanding of key concepts.

This is a popular solution!

Trending now
This is a popular solution!

Step by step
Solved in 4 steps with 2 images

Knowledge Booster


Learn more about
Need a deep-dive on the concept behind this application? Look no further. Learn more about this topic, economics and related others by exploring similar questions and additional content below.Recommended textbooks for you

Economics (MindTap Course List)
Economics
ISBN:
9781337617383
Author:
Roger A. Arnold
Publisher:
Cengage Learning

Economics (MindTap Course List)
Economics
ISBN:
9781337617383
Author:
Roger A. Arnold
Publisher:
Cengage Learning


Economics: Private and Public Choice (MindTap Cou…
Economics
ISBN:
9781305506725
Author:
James D. Gwartney, Richard L. Stroup, Russell S. Sobel, David A. Macpherson
Publisher:
Cengage Learning