
Related questions
Concept explainers
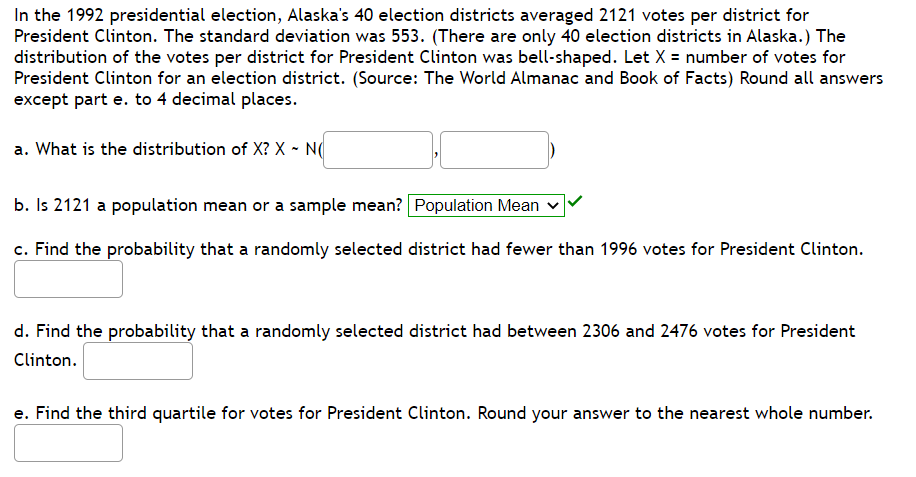
In the 1992 presidential election, Alaska's 40 election districts averaged 2121 votes per district for President Clinton. The standard deviation was 553. (There are only 40 election districts in Alaska.) The distribution of the votes per district for President Clinton was bell-shaped. Let X = number of votes for President Clinton for an election district. (Source: The World Almanac and Book of Facts) Round all answers except part e. to 4 decimal places.
a. What is the distribution of X? X ~ N(,)
c. Find the
d. Find the probability that a randomly selected district had between 2306 and 2476 votes for President Clinton.
e. Find the third

Hey, since there are multiple subparts posted, we will answer first three subparts. If you want any specific subpart to be answered then please submit that subpart only or specify the subpart in your message.
Given that,
In the 1992 presidential election, Alaska's 40 election districts averaged 2121 votes per district for President Clinton. The standard deviation was 553. (There are only 40 election districts in Alaska.) The distribution of the votes per district for President Clinton was bell-shaped. Let X = number of votes for President Clinton for an election district.

Step by stepSolved in 4 steps


- A popular theory is that presidential candidates have an advantage if they are taller than their main opponents. Listed are heights (in centimeters) of randomly selected presidents along with the heights of their main opponents. Height cm of president 182 177 180 177 198 181 Height cm of main opponent 169 172 166 184 184 179 a.Identify the test statistic.t=? b. Identify the p value?arrow_forwardThe following table shows the systolic blood pressure of 5 women and 5 men. Women 110 120 95 140 125 Men 114 128 120 152 100 If you plan to test if there is a difference in the blood pressure for men and women, answer the following: What is the Test Statistic?Write to 4 decimal places.arrow_forwardPlease helparrow_forward
- The best predicted weight for a bear with a chest size of 51 inches is ? pounds. Is the result close to the actual weight of 452 pounds? A. This result is very close to the actual weight of the bear. B. This result is close to the actual weight of the bear. C. This result is not very close to the actual weight of the bear. D. This result is exactly the same as the actual weight of the bear.arrow_forwardUse the provided histogram to answer questions about the number of births for each age group. 1. How many births occurs among women over the age of 40? 2. What percentage of births occurred among women between the ages of 38 and 40?arrow_forwardUse the same scales to construct boxplots for the pulse rates of males and females from the accompanying data sets. Use the boxplots to compare the two data sets. Click the icon to view the data sets. Men's Pulse Rates 62 60 70 70 62 86 82 77 76 74 Full data set 87 53 90 65 69 56 80 61 76 80 53 60 67 63 62 49 70 60 70 56 64 77 67 60 69 73 73 62 50 57 Women's Pulse Rates 78 68 70 70 77 76 98 70 66 78 70 58 74 77 78 92 95 60 100 100 77 64 84 63 72 77 75 90 88 73 83 71 76 103 62 70 70 89 74 80 Choose the graphs that represent (picture attached!!) Compare the two boxplots. Choose the correct answer below. A. In general, it appears that males have higher pulse rates than females. The variation among the male pulse rates is much greater…arrow_forward
- show how to answer and put into graphing calculator. Ppool = .126arrow_forwardRefer to the dotplot below. adm. 30 10 20 40 50 60 70 a. How many values are displayed? b. What data value is an outlier? c. How many data values are less than 30? 80 90 100arrow_forwardGiven the set of 3 data points 82, ____, _____ Find the 2 missing terms if the median is 84. Once you find one answer, explain how you found your answer and if it is possible to have more than one answer. Please give details about the other possible data pointsarrow_forward
- Hi, I need help with the rest of the parts for this exercise. Please complete as much as possible. ( It is completed all the way to 2C) Thanks in advance .arrow_forward-Ensure complete frequency table and histogram using the values below. -Convert the frequencies into percentages and record in the‘%’column. Using the formula Percentage formula= count/total x 100 A sample is provided beside the valuesarrow_forwardTo reduce bias, one should a. get a better instrument b. take the average of several measurements c. use rate rather than a count d. unbias your resultsarrow_forward
- MATLAB: An Introduction with ApplicationsStatisticsISBN:9781119256830Author:Amos GilatPublisher:John Wiley & Sons Inc
 Probability and Statistics for Engineering and th...StatisticsISBN:9781305251809Author:Jay L. DevorePublisher:Cengage Learning
 Statistics for The Behavioral Sciences (MindTap C...StatisticsISBN:9781305504912Author:Frederick J Gravetter, Larry B. WallnauPublisher:Cengage Learning
  Elementary Statistics: Picturing the World (7th E...StatisticsISBN:9780134683416Author:Ron Larson, Betsy FarberPublisher:PEARSON
 The Basic Practice of StatisticsStatisticsISBN:9781319042578Author:David S. Moore, William I. Notz, Michael A. FlignerPublisher:W. H. Freeman
 Introduction to the Practice of StatisticsStatisticsISBN:9781319013387Author:David S. Moore, George P. McCabe, Bruce A. CraigPublisher:W. H. Freeman