
MATLAB: An Introduction with Applications
6th Edition
ISBN: 9781119256830
Author: Amos Gilat
Publisher: John Wiley & Sons Inc
expand_more
expand_more
format_list_bulleted
Related questions
Question
-Ensure complete frequency table and histogram using the values below.
-Convert the frequencies into percentages and record in the‘%’column. Using the formula
Percentage formula= count/total x 100
A sample is provided beside the values
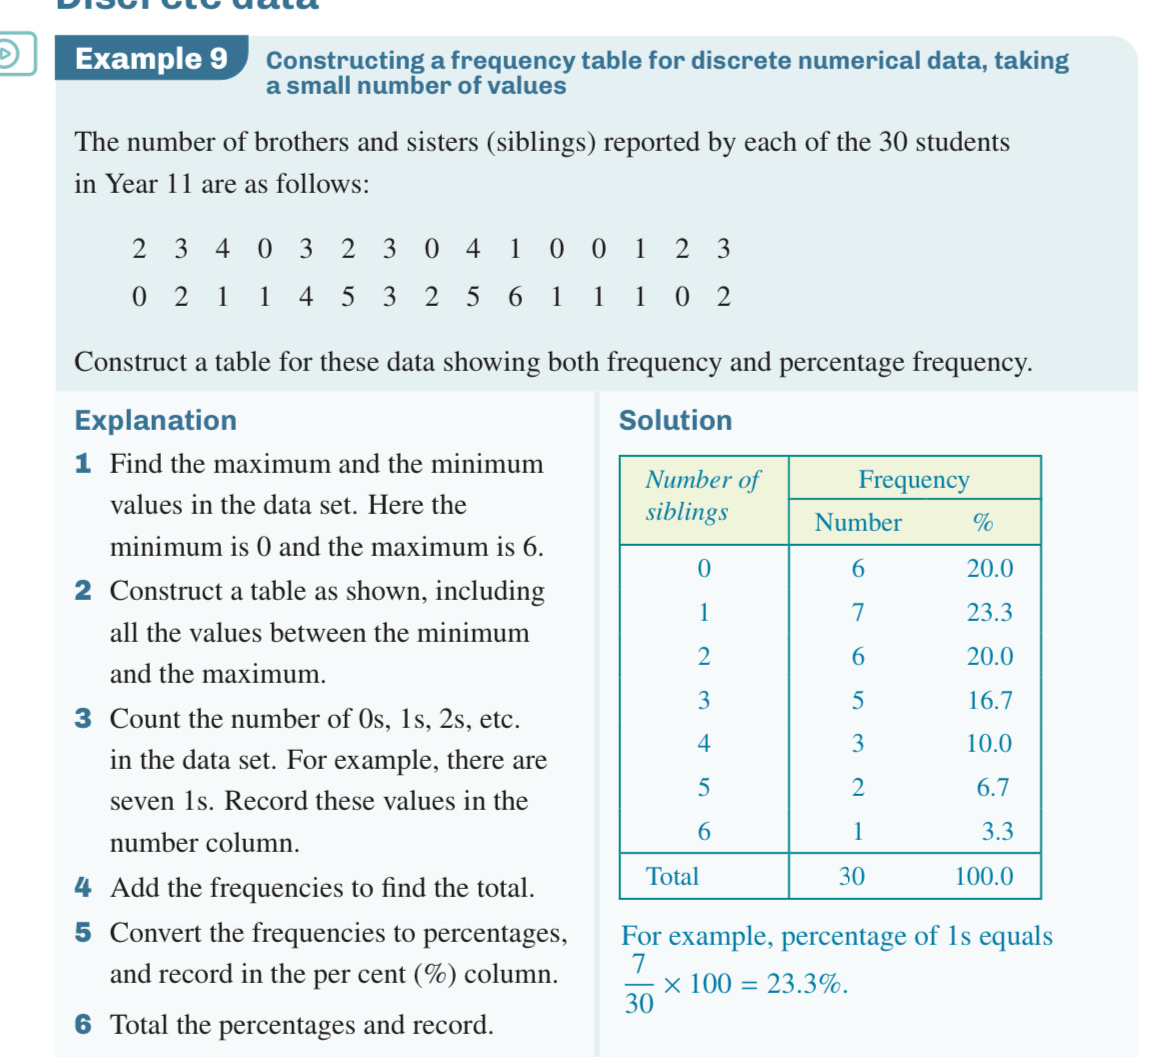

Transcribed Image Text:Example 9 Constructing a frequency table for discrete numerical data, taking
a small number of values
The number of brothers and sisters (siblings) reported by each of the 30 students
in Year 11 are as follows:
2 3 4 03
2304
1 00 1 2 3
256 1 1
1 02
02 1 1 453
Construct a table for these data showing both frequency and percentage frequency.
Explanation
1 Find the maximum and the minimum
values in the data set. Here the
minimum is 0 and the maximum is 6.
2 Construct a table as shown, including
all the values between the minimum
and the maximum.
3 Count the number of 0s, 1s, 2s, etc.
in the data set. For example, there are
seven 1s. Record these values in the
number column.
4 Add the frequencies to find the total.
5 Convert the frequencies to percentages,
and record in the per cent (%) column.
6 Total the percentages and record.
Solution
Number of
Frequency
siblings
Number
%
0
6
20.0
1
7
23.3
2
6
20.0
5
16.7
4
3
10.0
5
2
6.7
6
1
3.3
Total
30
100.0
23
For example, percentage of 1s equals
7
x 100 = 23.3%.
30

Transcribed Image Text:b. Construct a frequency histogram using the frequency table created in part a.
c. What can you analyse about the data distribution?
Expert Solution
This question has been solved!
Explore an expertly crafted, step-by-step solution for a thorough understanding of key concepts.

Step by stepSolved in 2 steps with 1 images

Knowledge Booster

Similar questions
- At the local high school, the parents were asked to provide the number of children in their family. Describe the type of data collected. Bivariate and Categorical Univariate and Categorical Bivariate and Quantitative Univariate and Quantitativearrow_forwardPlease do not give solution in image format thanku A car salesman collected data on how many cars were sold at a dealership per day for two weeks. The results were as follows: 6, 7, 4, 3, 1, 2, 6, 6, 6, 7, 4, 4. Make a frequency table and then make a histogram based on that frequency table. What is the shape of the distribution? O Skewed to the right O Skewed to the left O Bimodal O Symmetricalarrow_forwardWhat value corresponds to the 30th percentile?arrow_forward
- A Frequency table of grades has five classes (A, B, C, D, F) with frequencies of 4, 15, 16, 4 and 1 respectively. using percentages what other relative frequencies of the five classes?arrow_forwardA survey of 100 students are taken. 32 Yes and 68 no. Find the point estimate of p and 96% CI.arrow_forwardThe histogram below gives the length of service of members of the Department of Chemistry at a particular university. The classes, in years of service, are 0-4.9, 5-9.9, etc., and the vertical axis represents the number of faculty. What percent of the department faculty have less than 25 years of service?$ Note: You answer should represent a propotion in the form of percentage.arrow_forward
- what is ther interquartile range of the data?arrow_forwardDescribe when you would use an independent samples t-test versus a dependent samplest-test.arrow_forwardThe table below consists of 7 numbers. Find the percentile of the value 56. (Note: Percentiles are always rounded to the nearest whole number.) 56 84 60 21 47 81 35 56 represents the -th percentilearrow_forward
- For the data set: {25, 4, 4, 7, 10, 13, 8, 3, 5, 8, 6, 3, 5. 6, 6, 5, 5, 10, 5, 7, 14, 6, 4} Find the upper and lower outlier boundaries.arrow_forwardIs parameter proportion the same as statistical proportion. so lets say the statistical proportion is 0.49. Would the parameter proportion be 0.49 as well ?arrow_forwardhelparrow_forward
arrow_back_ios
SEE MORE QUESTIONS
arrow_forward_ios
Recommended textbooks for you
- MATLAB: An Introduction with ApplicationsStatisticsISBN:9781119256830Author:Amos GilatPublisher:John Wiley & Sons Inc
 Probability and Statistics for Engineering and th...StatisticsISBN:9781305251809Author:Jay L. DevorePublisher:Cengage Learning
 Statistics for The Behavioral Sciences (MindTap C...StatisticsISBN:9781305504912Author:Frederick J Gravetter, Larry B. WallnauPublisher:Cengage Learning
  Elementary Statistics: Picturing the World (7th E...StatisticsISBN:9780134683416Author:Ron Larson, Betsy FarberPublisher:PEARSON
 The Basic Practice of StatisticsStatisticsISBN:9781319042578Author:David S. Moore, William I. Notz, Michael A. FlignerPublisher:W. H. Freeman
 Introduction to the Practice of StatisticsStatisticsISBN:9781319013387Author:David S. Moore, George P. McCabe, Bruce A. CraigPublisher:W. H. Freeman
MATLAB: An Introduction with Applications
Statistics
ISBN:9781119256830
Author:Amos Gilat
Publisher:John Wiley & Sons Inc
Probability and Statistics for Engineering and th...
Statistics
ISBN:9781305251809
Author:Jay L. Devore
Publisher:Cengage Learning
Statistics for The Behavioral Sciences (MindTap C...
Statistics
ISBN:9781305504912
Author:Frederick J Gravetter, Larry B. Wallnau
Publisher:Cengage Learning
Elementary Statistics: Picturing the World (7th E...
Statistics
ISBN:9780134683416
Author:Ron Larson, Betsy Farber
Publisher:PEARSON
The Basic Practice of Statistics
Statistics
ISBN:9781319042578
Author:David S. Moore, William I. Notz, Michael A. Fligner
Publisher:W. H. Freeman
Introduction to the Practice of Statistics
Statistics
ISBN:9781319013387
Author:David S. Moore, George P. McCabe, Bruce A. Craig
Publisher:W. H. Freeman