FINANCIAL ACCOUNTING
10th Edition
ISBN: 9781259964947
Author: Libby
Publisher: MCG
expand_more
expand_more
format_list_bulleted
Question

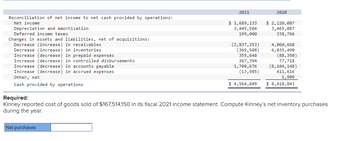
Transcribed Image Text:Reconciliation of net income to net cash provided by operations:
Net income
Depreciation and amortization
Deferred income taxes.
Changes in assets and liabilities, net of acquisitions:
Decrease (increase) in receivables
Decrease (increase) in inventories
Increase (decrease) in prepaid expenses
Increase (decrease) in controlled disbursements
Increase (decrease) in accounts payable
Increase (decrease) in accrued expenses
Other, net
Cash provided by operations
2021
Net purchases
$1,689,233
3,445,504
199,000
(2,837,353)
(349,508)
355,648
367,394
1,708,676
(13,985)
$4,564,609
2020
$ 2,220,087
3,465,087
338,766
4,060, 668
6,035,490
(88,350)
77,718
(8,104,148)
411,616
1,909
$ 8,418,843
Required:
Kinney reported cost of goods sold of $167,514,150 in its fiscal 2021 income statement. Compute Kinney's net inventory purchases
during the year.

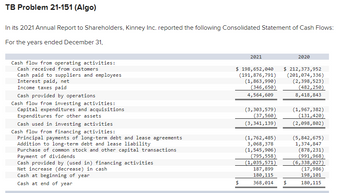
Transcribed Image Text:TB Problem 21-151 (Algo)
In its 2021 Annual Report to Shareholders, Kinney Inc. reported the following Consolidated Statement of Cash Flows:
For the years ended December 31,
Cash flow from operating activities:
Cash received from customers
Cash paid to suppliers and employees
Interest paid, net
Income taxes paid
Cash provided by operations.
Cash flow from investing activities:
Capital expenditures and acquisitions
Expenditures for other assets
Cash used in investing activities
Cash flow from financing activities:
Principal payments of long-term debt and lease agreements
Addition to long-term debt and lease liability
Purchase of common stock and other capital transactions
Payment of dividends
Cash provided by (used in) financing activities
Net increase (decrease) in cash
Cash at beginning of year
Cash at end of year
2021
$ 198,652,040
(191,876,791)
(1,863,990)
(346,650)
4,564,609
$
(3,303,579)
(37,560)
(3,341,139)
(1,762,485)
3,068,378
(1,545,906)
(795,558)
(1,035,571)
187,899
180, 115
368,014
2020
$ 212,373,952
(201,074,336)
(2,398,523)
(482,250)
8,418,843
$
(1,967,382)
(131,420)
(2,098,802)
(5,842,675)
1,374,847
(878,231)
(991,968)
(6,338,027)
(17,986)
198, 101
180, 115
Expert Solution
This question has been solved!
Explore an expertly crafted, step-by-step solution for a thorough understanding of key concepts.
Step by stepSolved in 2 steps

Knowledge Booster
Learn more about
Need a deep-dive on the concept behind this application? Look no further. Learn more about this topic, accounting and related others by exploring similar questions and additional content below.Similar questions
- The following are financial data taken from the annual report of Foundotos Company: Year 2 $134,448 51,981 37,154 57,504 Net sales Gross property, plant and equipment Accumulated depreciation Intangible assets (net) A. Calculate the following ratios for Year 1 and Year 2: 1. Fixed asset turnover 2. Accumulated depreciation divided-by-gross fixed assets B. What do the trends in these ratios reveal about Foundotos? Year 1 $130,060 47,744 34,180 36,276arrow_forwardUse the following information to answer this question: Net sales Cost of goods sold Depreciation Earnings before interest and taxes Interest paid Taxable income Taxes Net income Cash Accounts received Inventory Windswept, Incorporated 2021 Income Statement ($ in millions) Total Net fixed assets Total assets 2020 $ 270 1, 090 1, 760 $ 3, 120 3, 460 $ 6, 580 2021 $ 290 $ 9,950 7,900 365 990 1, 650 $ 1,685 98 Windswept, Incorporated 2020 and 2021 Balance Sheets ($ in millions) $ 1,587 333 $ 1,254 Accounts payable Long-term debt Common stock Retained earnings $ 2,930 4, 040 $ 6,970 Total liabilities & equity 2020 $ 1,540 1, 060 3, 340 640 $ 6, 580 2021 $ 1,812 1, 248 3, 020 890 $ 6,970 Windswept, Incorporated, has 540 million shares of stock outstanding. Its price-earnings ratio for 2021 is 15. What is the market price per share of stock?arrow_forwardIn its income statement for the year ended December 31, 2020, Cheyenne Corp. reported the following condensed data. Operating expenses Cost of goods sold Interest expense (a) $753,390 1,293,700 72,600 V V > M Interest revenue eTextbook and Media Loss on disposal of plant assets Net sales Other comprehensive income Prepare a multiple-step income statement. (List other revenues before other expenses. If there is a net loss then enter the amount using either a negative sign preceding the number e.g. -45 or parentheses e.g. (45).) Cheyenne Corp. Income Statement For the Year Ended December 31, 2020 $ 30,920 $ 16,420 2.404.800 6.970 $arrow_forward
- Net sales Cost of goods sold Gross profit Expenses: Operating expenses Depreciation expense Loss on sale of land Interest expense Income tax expense Total expenses Net income Assets Current assets: Cash For the Years Ended December 31 2025 $ 3,560,000 2,490,000 1,070,000 Accounts receivable Inventory Prepaid rent Long-term assets: Investment in bonds Land Equipment Less: Accumulated depreciation Total assets Liabilities and Stockholders' Equity Current liabilities: Accounts payable Interest payable Income tax payable Long-term liabilities: Notes payable Problem 12-6A (Static) Part 1 Stockholders' equity: Common stock Retained earnings Total liabilities and stockholders' equity Receivables turnover ratio Inventory turnover ratio Current ratio Debt to equity ratio 965,000 40,000 0 23,000 9,000 1,037,000 $ 33,000 2024 38.3 times 15.1 times % 2024 $ 3,086,000 1,960,000 1,126,000 VIRTUAL GAMING SYSTEMS Balance Sheets December 31 2025 39.3 times 19.5 times 868,000 32,000 % 9,000 20,000…arrow_forwardPlease help me with show all calculation thankuarrow_forwardPlease solve the question sub-division b alone.arrow_forward
- Problem: Remesh Corporation prepared the following income statement and statement of retained earnings for the year ended December 31, 2021. Remesh Corporation December 31, 2021 Expense and Profit Statement Dollars in thousands Sales (net) $206,000 Less: Selling Expenses (20,600) Net Sales $185,400 Add: Interest Revenue 2,400 Add: Gain on sale of equipment 3,600 Gross Sales Revenue $191,400 Less: Cost of operations: Cost of Goods Sold $126,100 Correction of overstatement in last years income because of error $5,500 (net of tax credit) $3850 Dividend cost ($0.50 per share for 8k common shares) $4000 Unusual loss due to a hurricane, $6,400 (net of tax credit) $1,920 ($135,870) Taxable Revenues $55,530 Less: Income tax on income from continuing operations $16,659 Net income $38871 Miscellaneous Deductions Loss from operations of…arrow_forwardBased on the financial statement information of Monster Inc. in the following table, answer the following questions: Unit in Million US$ accounts receivable annual sales Cost of goods depreciation fixed assets inventory 2019 150 71 31 Start of 2019 52 222 91 End of 2019 59 275 106 1) Calculate the Fixed-asset turnover, Inventory turnover ratio and Days receivable of Monster Inc 0.87 0.63 72 2) Compare the above results with the following industry average information, comment on their implications in terms of efficiency of asset utilisation. Industry average (Unit 2019 in Million US$) Fixed-asset turnover Inventory turnover ratio Days receivablearrow_forwardUse attachment to answer the following Assume all assets are operating assets; all current liabilities are operating liabilities. Return on net operating assets for 2006 is: a) 11.30% b) 11.03% c) 9.93% d) 11.19arrow_forward
- K Winky Flash Photo reported the following figures on its December 31, 2024, income statement and balance sheet: (Click the icon to view the figures.) Compute the asset turnover ratio for 2024. Round to two decimal places. Data table Net sales Cash Accounts Receivable Merchandise Inventory Prepaid Expenses Property, Plant, and Equipment, net Print + + 460,000 Dec. 31, 2024 Dec. 31, 2023 $ 33,000 $ 26,000 60,000 58,000 71,000 78,000 11,000 7,000 101,000 16,000 Done - = - X Asset turnover ratioarrow_forwardReturn on Assets Ratio and Asset Turnover Ratio Northern Systems reported the following financlal data (in millions) In its annual report: 2018 2019 Net Income $9,050 $7.500 Net Sales 52,350 37,200 Total Assets 58,734 68,128 If the company's total assets are $55,676 in 2017, calculate the company's: (a) return on assets (round answers to one decimal place - ex: 10.79%6) (b) asset turnover for 2018 and 2019 (round answers to two decimal places) 2018 2019 a. Return on Assets Ratio 96 96 b. Asset Turnover Ratio Check O Prevlous Save Answersarrow_forwardNeed help calculating: A. Economic value added and B. Return on Capitalarrow_forward
arrow_back_ios
SEE MORE QUESTIONS
arrow_forward_ios
Recommended textbooks for you

 AccountingAccountingISBN:9781337272094Author:WARREN, Carl S., Reeve, James M., Duchac, Jonathan E.Publisher:Cengage Learning,
 Accounting Information SystemsAccountingISBN:9781337619202Author:Hall, James A.Publisher:Cengage Learning,
 Horngren's Cost Accounting: A Managerial Emphasis...AccountingISBN:9780134475585Author:Srikant M. Datar, Madhav V. RajanPublisher:PEARSON
 Intermediate AccountingAccountingISBN:9781259722660Author:J. David Spiceland, Mark W. Nelson, Wayne M ThomasPublisher:McGraw-Hill Education
 Financial and Managerial AccountingAccountingISBN:9781259726705Author:John J Wild, Ken W. Shaw, Barbara Chiappetta Fundamental Accounting PrinciplesPublisher:McGraw-Hill Education


Accounting
Accounting
ISBN:9781337272094
Author:WARREN, Carl S., Reeve, James M., Duchac, Jonathan E.
Publisher:Cengage Learning,

Accounting Information Systems
Accounting
ISBN:9781337619202
Author:Hall, James A.
Publisher:Cengage Learning,

Horngren's Cost Accounting: A Managerial Emphasis...
Accounting
ISBN:9780134475585
Author:Srikant M. Datar, Madhav V. Rajan
Publisher:PEARSON

Intermediate Accounting
Accounting
ISBN:9781259722660
Author:J. David Spiceland, Mark W. Nelson, Wayne M Thomas
Publisher:McGraw-Hill Education

Financial and Managerial Accounting
Accounting
ISBN:9781259726705
Author:John J Wild, Ken W. Shaw, Barbara Chiappetta Fundamental Accounting Principles
Publisher:McGraw-Hill Education