
MATLAB: An Introduction with Applications
6th Edition
ISBN: 9781119256830
Author: Amos Gilat
Publisher: John Wiley & Sons Inc
expand_more
expand_more
format_list_bulleted
Related questions
Topic Video
Question
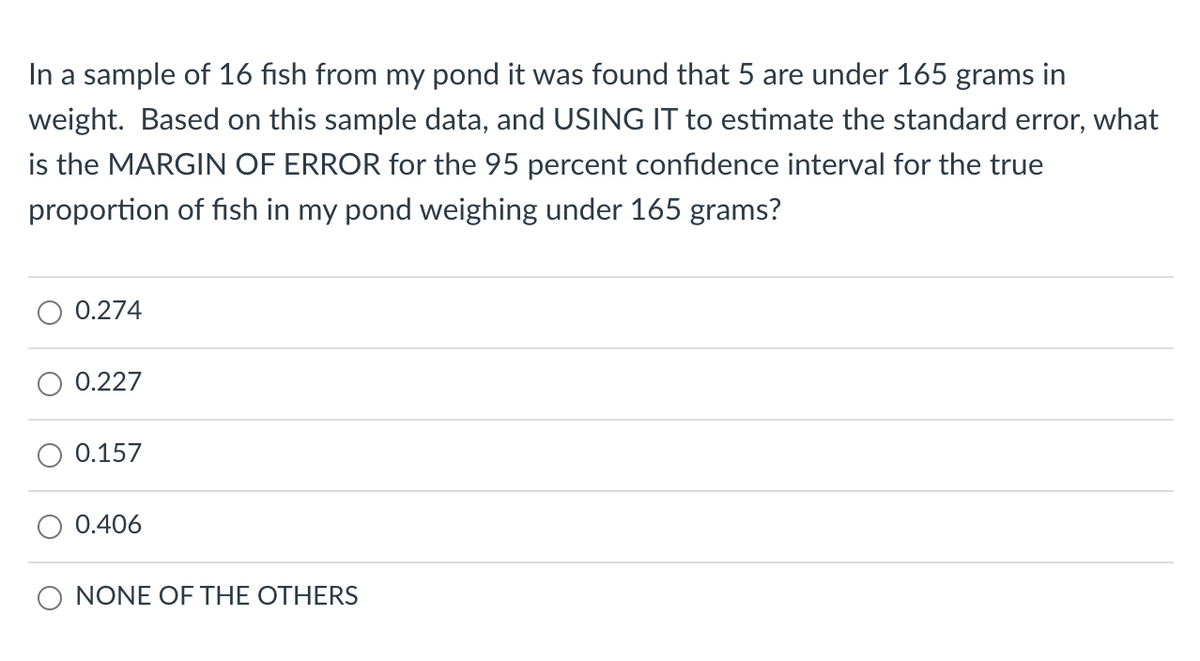

Transcribed Image Text:In a sample of 16 fish from my pond, it was found that 5 are under 165 grams in weight. Based on this sample data, and using it to estimate the standard error, what is the margin of error for the 95 percent confidence interval for the true proportion of fish in my pond weighing under 165 grams?
- ○ 0.274
- ○ 0.227
- ○ 0.157
- ○ 0.406
- ○ NONE OF THE OTHERS
Expert Solution
This question has been solved!
Explore an expertly crafted, step-by-step solution for a thorough understanding of key concepts.

This is a popular solution

Trending nowThis is a popular solution!

Step by stepSolved in 2 steps

Knowledge Booster


Learn more about
Need a deep-dive on the concept behind this application? Look no further. Learn more about this topic, statistics and related others by exploring similar questions and additional content below.Similar questions
- A repeated measures study is done to measure the change in IQ test scores taken on Monday versus those taken on Friday. There were n=9 participants in the study. The mean difference was MD =-5 points and the standard error for the mean difference was SMD=0.51. Construct a 95% confidence interval to estimate the size of the population mean difference.arrow_forwardIn order to estimate the average GPA of all students at SCC, we selected a random sample of 36 students and found that their average GPA is 2.1 with a s. d. of 0.8.Construct a 95% confidence interval for the average GPA of all students at SCC.arrow_forwardIn a sample of 10 randomly selected black bears from northeast Pennsylvania, the sample mean was 214.1 pounds and the sample standard deviation was 51.1 pounds. Construct a 99% confidence interval estimate for the population standard deviation of all black bears in this region.arrow_forward
- A random sample of high school seniors were asked whether they were applying for college. The resulting confidence interval for the proportion of students applying for college is (0.65,0.69). What is the margin of error?arrow_forwardA sample of 20 cows is drawn to estimate the mean weight of a large herd of cattle. If the standard deviation of the sample is 96 kg, what is the margin of error in a 90% confidence interval estimate?arrow_forwardA recent survey of two countries in South America reports on data about foreign-born citizens. Of 500 randomly selected people in Peru, 125 reported as being born in another country; meanwhile, 75 of 800 randonly selected Argentinians reported as being foreign-born. Use this information to create a 95% confidence interval for the true difference in proportions of foreign born citizens between Peru and Argentina.arrow_forward
- The Aloha Taxi Cab Company of Honolulu, Hawaii, wants to estimate the mean life of tires on its cabs. A random sample of 15 tires from the cabs are found to have a life of 18,280 miles with sample standard deviation of 1,310 miles. Find a 90% confidence interval for the mean life of all such tires on Aloha Taxi Cabs.arrow_forwardResearchers from a certain country were interested in how characteristics of the spleen of residents in their tropical environment compare to those found elsewhere in the world. The researchers randomly sampled 91 males and 109 females in their country. The mean and standard deviation of the spleen lengths for the males were 10.9 cm and 0.9 cm, respectively, and those for the females were 9.8 cm and 1.1 cm, respectively. Determine a 95% confidence interval for the difference between mean spleen lengths of males and females in this country. Click here to view page 1 of the table of critical values of t. Click here to view page 2 of the table of critical values of t. Let population 1 be all males in the country and let population 2 be all females in the country. The 95% confidence interval for µ1 - 4½ is ( | D (Round to three decimal places as needed. Use ascending order.)arrow_forwardA study by the department of education of a certain state was trying to determine the mean SAT scores of the graduating high school seniors. The study examined the scores of a random sample of 190 graduating seniors and found the mean score to be 520 with a standard deviation of 87. Determine a 95% confidence interval for the mean, rounding all values to the nearest tenth.arrow_forward
- For a random sample of 64 overweight men, the mean of the number of pounds that they were overweight was 30. The standard deviation of the population is 4.2 pounds. (a) Find the best point estimate for the average number of excess pounds for all overweight men. (b) Construct a 95% confidence interval of the mean of these pounds.arrow_forwardA researcher collected data on a sample of 40 stores of a large retail chain, and for each store translate data to a conventional performance rating. The average performance rating among sample values is calculated to be 275. calculate an approxiate 95% confidence interval for the mean performance rating of all stories of the chain. Assume the standard deviation of performance ratings among all store in the chain is 90.arrow_forwardThe Consumer Product Safety Commission regulates products sold for use with children. An investigator is tasked with determining whether a male child will get sick after being exposed to a certain brand of house paint than a female child. Data was collected that on 1854 children between the ages one and four, all of whom were exposed to the same brand of house paint. 985 were boys, while 869 were girls. Determine a 95% confidence interval for the difference in proportions of male and female children, ages one to four, who will get sick. Round to four decimal places.With % confidence, it can be concluded that the difference in proportions of between male and female children, ages one to four, who get sick after being exposed to this brand of house paint is (p1 - p2) is between BLANK and BLANK .arrow_forward
arrow_back_ios
SEE MORE QUESTIONS
arrow_forward_ios
Recommended textbooks for you
- MATLAB: An Introduction with ApplicationsStatisticsISBN:9781119256830Author:Amos GilatPublisher:John Wiley & Sons Inc
 Probability and Statistics for Engineering and th...StatisticsISBN:9781305251809Author:Jay L. DevorePublisher:Cengage Learning
 Statistics for The Behavioral Sciences (MindTap C...StatisticsISBN:9781305504912Author:Frederick J Gravetter, Larry B. WallnauPublisher:Cengage Learning
  Elementary Statistics: Picturing the World (7th E...StatisticsISBN:9780134683416Author:Ron Larson, Betsy FarberPublisher:PEARSON
 The Basic Practice of StatisticsStatisticsISBN:9781319042578Author:David S. Moore, William I. Notz, Michael A. FlignerPublisher:W. H. Freeman
 Introduction to the Practice of StatisticsStatisticsISBN:9781319013387Author:David S. Moore, George P. McCabe, Bruce A. CraigPublisher:W. H. Freeman
MATLAB: An Introduction with Applications
Statistics
ISBN:9781119256830
Author:Amos Gilat
Publisher:John Wiley & Sons Inc
Probability and Statistics for Engineering and th...
Statistics
ISBN:9781305251809
Author:Jay L. Devore
Publisher:Cengage Learning
Statistics for The Behavioral Sciences (MindTap C...
Statistics
ISBN:9781305504912
Author:Frederick J Gravetter, Larry B. Wallnau
Publisher:Cengage Learning
Elementary Statistics: Picturing the World (7th E...
Statistics
ISBN:9780134683416
Author:Ron Larson, Betsy Farber
Publisher:PEARSON
The Basic Practice of Statistics
Statistics
ISBN:9781319042578
Author:David S. Moore, William I. Notz, Michael A. Fligner
Publisher:W. H. Freeman
Introduction to the Practice of Statistics
Statistics
ISBN:9781319013387
Author:David S. Moore, George P. McCabe, Bruce A. Craig
Publisher:W. H. Freeman