
MATLAB: An Introduction with Applications
6th Edition
ISBN: 9781119256830
Author: Amos Gilat
Publisher: John Wiley & Sons Inc
expand_more
expand_more
format_list_bulleted
Related questions
Question
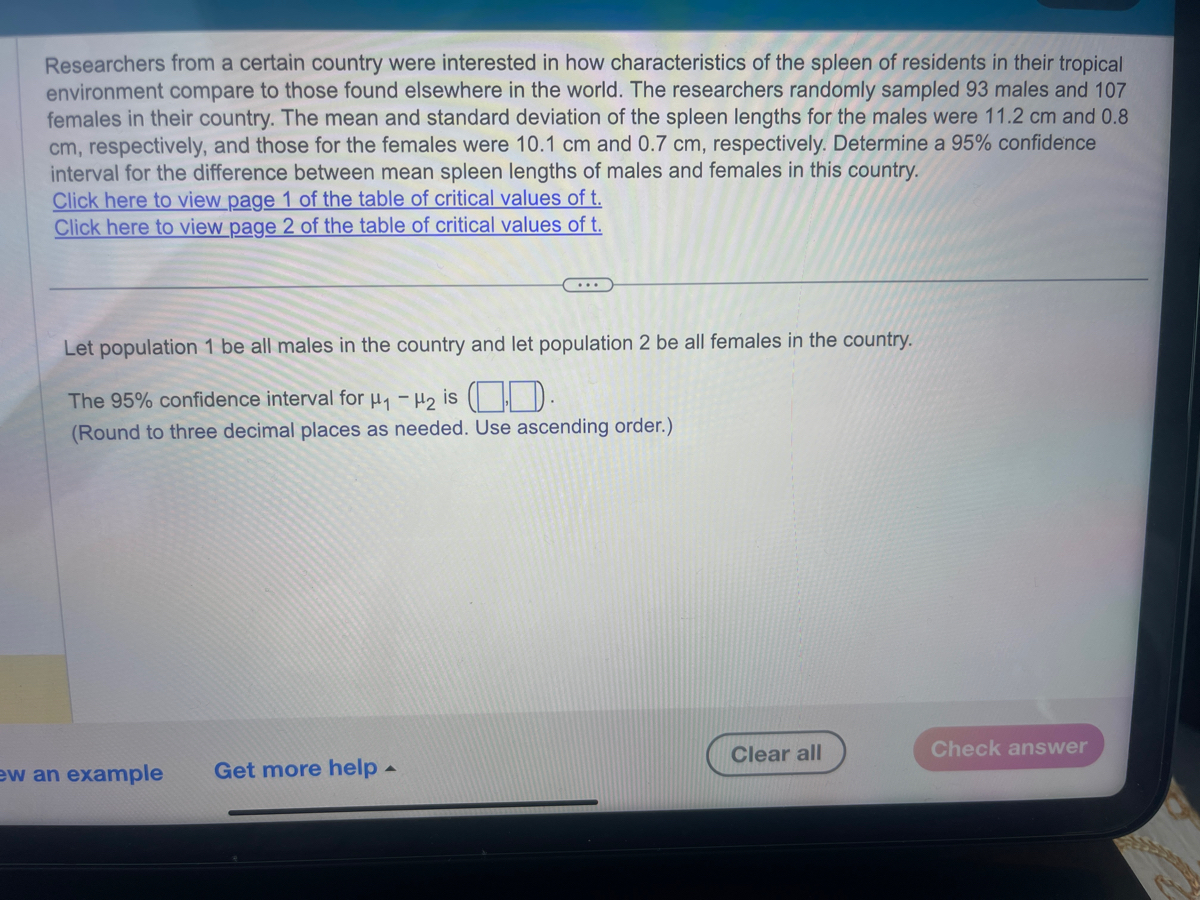

Transcribed Image Text:Researchers from a certain country were interested in how characteristics of the spleen of residents in their tropical
environment compare to those found elsewhere in the world. The researchers randomly sampled 93 males and 107
females in their country. The mean and standard deviation of the spleen lengths for the males were 11.2 cm and 0.8
cm, respectively, and those for the females were 10.1 cm and 0.7 cm, respectively. Determine a 95% confidence
interval for the difference between mean spleen lengths of males and females in this country.
Click here to view page 1 of the table of critical values of t.
Click here to view page 2 of the table of critical values of t.
...
Let population 1 be all males in the country and let population 2 be all females in the country.
The 95% confidence interval for H₁-H₂ is 0.
(Round to three decimal places as needed. Use ascending order.)
ew an example Get more help -
Clear all
Check answer
Expert Solution
This question has been solved!
Explore an expertly crafted, step-by-step solution for a thorough understanding of key concepts.

This is a popular solution

Trending nowThis is a popular solution!

Step by stepSolved in 3 steps with 1 images

Knowledge Booster

Similar questions
- The amount of time it takes students to travel to school can vary greatly depending on how far a student lives from the school and what mode of transportation they take to school. A student claims that the average travel time to school for his large district is 20 minutes. To further investigate this claim, he selects a random sample of 50 students from the school and finds that their mean travel time is 22.4 minutes with a standard deviation of 5.9 minutes. He would like to conduct a significance test to determine if there is convincing evidence that the true mean travel time for all students who attend this school is greater than 20 minutes. What are the appropriate hypotheses? A) H0: μ = 20 versus Ha: μ < 20, where μ = the true mean travel time for all students who attend this school B) H0: μ = 20 versus Ha: μ > 20, where μ = the true mean travel time for all students who attend this school C) H0: μ = 20 versus Ha: μ < 20, where μ = the mean travel time for the 50…arrow_forwardIn a study of woman's bone health, a random sample of 8 women was taken, and their daily calcium intake measured. The sample mean was 926 milligrams, and the sample standard deviation was 427.2 milligrams. What is the upper limit of a 99% confidence interval for the mean daily calcium intake of all women?arrow_forwardThe pH of rain, measured at a weather station in Michigan, was observed for 39 consecutive rain storms. The sample mean is 4.6982 and the sample variance is 0.39623. Obtain a 99% confidence interval for the mean pH of the population of storms at that location.arrow_forward
- Given that the researcher wants to be sure the mean difference in the change in hemoglobin levels has a margin of error no more than 0.2 g/dL and the difference in the stand deviation between the mean hemoglobin levels for the two forms of iron supplements used to treat anemia is 1.2 g/dL, what is the desired number of recruits for the study, assuming the individuals will participate in a crossover trial, if the study’s attrition rate is expected to be .25? Group of answer choices n = 139 n = 554 n = 185 n = 55,320arrow_forwardResearchers from a certain country were interested in how characteristics of the spleen of residents in their tropical environment compare to those found elsewhere in the world. The researchers randomly sampled 93 males and 107 females in their country. The mean and standard deviation of the spleen lengths for the males were 10.8 cm and 0.9 cm, respectively, and those for the females were 10.2 cm and 0.7 cm, respectively. At the 5% significance level, do the data provide sufficient evidence to conclude that a difference exists in the mean spleen lengths of males and females in the country? Click here to view page 1 of the table of critical values of t. Click here to view page 2 of the table of critical values of t. O E. Ho: H1 H₂ Hai Hg = H2 Compute the test statistic. =(Round to two decimal places as needed.) Determine the critical value(s). t= OF. Ho: H1 H₂ Ha: H1 H₂ 0 (Round to three decimal places as needed. Use a comma to separate answers as needed.) What is the conclusion of the…arrow_forwardIn an old study, the weight of a certain breed of pig had a standard deviation of 3.8 pounds. What sample size should be used to estimate the mean weight of that breed of pig for a new study? Assume a margin of error of 0.7 pounds and a confidence level of 99% is desired.arrow_forward
- In a recent year, a sample of the South American Redeye Piranha was collected by fishermen on a particular river. Wildlife biologists regard this sample as a random sample of all Redeye Piranha in that river. The mean length of the 60 fish in the sample was 12.88 cm, and a 99% confidence level for the true mean length of all Redeye Piranha in that river is 12.09 cm to 13.67 cm. Explain what would happen to the length of the interval if the confidence level were decreased to 95%.arrow_forwardLooking at the number of chocolate chips in a sample of 40 Chips Ahoy regular cookies, we get a mean of 23.95 chocolate chips and a standard deviation of 2.55 chocolate chips. Construct a 99% confidence interval estimate of the mean number of chocolate chips in all such cookies.arrow_forwardA study has been made to compare the nicotine contents of two brands of cigarettes. Ten cigarettes of Brand A had an average nicotine content of 4.3 milligrams with a standard deviation of 0.6 milligram. Eight cigarettes of Brand B had an average nicotine content of 3 milligrams with a standard deviation of 0.4 milligram. Assume that the two sets of data are independent random samples from normal populations with equal variances. Answer the following, and round off your answer to three decimal places. (a) Find a pooled estimate of the population standard deviation. (b) Construct a 95% confidence interval for the difference between the mean nicotine contents of the two brands of cigarettes. (☐☐)arrow_forward
- Bone mineral density (BMD) is a measure of bone strength. Studies show that BMD declines after age 45. The impact of exercise may increase BMD. A random sample of 59 women between the ages of 41 and 45 with no major health problems were studied. The women were classified into one of two groups based upon their level of exercise activity: walking women and sedentary women. The 39 women who walked regularly had a mean BMD of 5.96 with a standard deviation of 1.22. The 20 women who are sedentary had a mean BMD of 4.41 with a standard deviation of 1.02. Which of the following inference procedures could be used to estimate the difference in the mean BMD for these two types of womenarrow_forwardThe growing seasons for a random sample of 35 U.S. cities were recorded, yielding a sample mean of 190.7 days and the population standard deviation of 54.2 days. Find a 95% confidence interval estimate of the true mean for the growing season in all U.S. cities.arrow_forwardin a test of the effectiveness of garlic for lowering cholesterol, 43 subjects were treated with garlic in a processed tablet form. Cholesterol levels were measured before and after the treatment. The changes in their levels of LDL cholesterol have a mean of 5.7 and a standard deviation of 17.7. Construct a 99% confidence interval estimate of the mean net change in LDL cholesterol after the garlic treatment. What does the confidence interval suggest about the effectiveness of garlic and reducing LDL cholesterol?arrow_forward
arrow_back_ios
SEE MORE QUESTIONS
arrow_forward_ios
Recommended textbooks for you
- MATLAB: An Introduction with ApplicationsStatisticsISBN:9781119256830Author:Amos GilatPublisher:John Wiley & Sons Inc
 Probability and Statistics for Engineering and th...StatisticsISBN:9781305251809Author:Jay L. DevorePublisher:Cengage Learning
 Statistics for The Behavioral Sciences (MindTap C...StatisticsISBN:9781305504912Author:Frederick J Gravetter, Larry B. WallnauPublisher:Cengage Learning
  Elementary Statistics: Picturing the World (7th E...StatisticsISBN:9780134683416Author:Ron Larson, Betsy FarberPublisher:PEARSON
 The Basic Practice of StatisticsStatisticsISBN:9781319042578Author:David S. Moore, William I. Notz, Michael A. FlignerPublisher:W. H. Freeman
 Introduction to the Practice of StatisticsStatisticsISBN:9781319013387Author:David S. Moore, George P. McCabe, Bruce A. CraigPublisher:W. H. Freeman
MATLAB: An Introduction with Applications
Statistics
ISBN:9781119256830
Author:Amos Gilat
Publisher:John Wiley & Sons Inc
Probability and Statistics for Engineering and th...
Statistics
ISBN:9781305251809
Author:Jay L. Devore
Publisher:Cengage Learning
Statistics for The Behavioral Sciences (MindTap C...
Statistics
ISBN:9781305504912
Author:Frederick J Gravetter, Larry B. Wallnau
Publisher:Cengage Learning
Elementary Statistics: Picturing the World (7th E...
Statistics
ISBN:9780134683416
Author:Ron Larson, Betsy Farber
Publisher:PEARSON
The Basic Practice of Statistics
Statistics
ISBN:9781319042578
Author:David S. Moore, William I. Notz, Michael A. Fligner
Publisher:W. H. Freeman
Introduction to the Practice of Statistics
Statistics
ISBN:9781319013387
Author:David S. Moore, George P. McCabe, Bruce A. Craig
Publisher:W. H. Freeman