ENGR.ECONOMIC ANALYSIS
14th Edition
ISBN: 9780190931919
Author: NEWNAN
Publisher: Oxford University Press
expand_more
expand_more
format_list_bulleted
Question

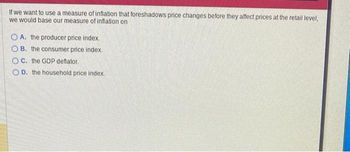
Transcribed Image Text:If we want to use a measure of inflation that foreshadows price changes before they affect prices at the retail level,
we would base our measure of inflation on
OA. the producer price index.
OB. the consumer price index.
OC. the GDP deflator.
OD. the household price index.
Expert Solution
This question has been solved!
Explore an expertly crafted, step-by-step solution for a thorough understanding of key concepts.
This is a popular solution
Trending nowThis is a popular solution!
Step by stepSolved in 2 steps

Knowledge Booster
Learn more about
Need a deep-dive on the concept behind this application? Look no further. Learn more about this topic, economics and related others by exploring similar questions and additional content below.Similar questions
- The CPI might overstate inflation because consumers may shift consumption to cheaper alternatives. Which bias is this associated with? unmeasured quality variety of goods import bias substitution biasarrow_forwardGiven the following table about the level of the consumer price index (CPI), perform calculations and show your work in the coming parts of the question. Consumer Price Index Year Consumer Price Index 2015 139.5 2016 144.7 2017 2018 160.1 2019 168.1 Calculate the inflation rate in 2016. If the inflation rate was 6 percent in 2018, calculate the CPI in 2017.arrow_forwardSuppose your nominal income in dubai economic rose by 6.4 percent and the price level rose by 4.2 percent in some year Required: a. Calculate the percentage of real income (approximately) in dubai b. Assume that the nominal income rose by 4.1 percent and your real income rose by 2.7 percent in some year, Calculate the approximate rate of inflationarrow_forward
- A) Inflation is the steady and widespread increase in prices. The inflation rate, measured by CPI, rose .1% in May (since April) and rose a total of 4% year-over-year (May 2022 to May 2023). Read the BLS report on the Consumer Price Index and identify an “item” or “all items” and begin to consider why the price increased. Do a news search or using (clear, logical, rational) reasoningexplain whether prices are increasing because demand increased or because supply decreased. Graph and explain your answerarrow_forwardUse the following data for 2019 to answer the question: Prices That Rose Health insurance Gasoline Lettuce (%) Prices That Fell +20.5 Televisions +12.8 Peanut butter +7.6 Oranges +5.9 Apples +4.2 Eggs +1.9 College textbooks +0.6 Coffee Average Inflation Rate: +2.3% Cigarettes Hot dogs College tuition Bananas (%) -20.8 -6.0 -5.5 -4.8 -4.6 -3.1 -1.4arrow_forwardRefer to the following table. Suppose the CPI basket consists of 10 pies of pizza and 20 bottles of milk respectively, and 2020 is the base year. Year Price of pizza Price of milk 2020 $250 $40 2021 $280 $45 а. Calculate the CPI in 2020 and 2021 respectively. What is the inflation rate in 2021? b. Suppose the minimum wage is $37.5 per hour in 2020, how much would it be in 2021 in order to maintain the same purchasing power in 2020?. С. Which one do you think is a better measure of a household's cost of living, CPI or GDP deflator? Why?*arrow_forward
- A) Inflation is the steady and widespread increase in prices. The inflation rate, measured by CPI, rose .1% in May (since April) and rose a total of 4% year-over-year (May 2022 to May 2023). Read the BLS report on the Consumer Price Index and identify an “item” or “all items” and begin to consider why the price increased. Do a news search or using (clear, logical, rational) reasoning explain whether prices are increasing because demand increased or because supply decreased. Graph and explain your answerarrow_forwardConsider a simple economy that only produces: pencils, t-shirts, and bananas. Using the information in the table below, calculate the inflation rate for 2020, as measured by the consumer price index. Product Pencils T-shirts Bananas 1.9% 1.1% O-1.1% 1.5% O-1.9% Quantity 8 15 5 Base year price (2010) $2 $5 $1 Price (2019) $3 $7 $1.50 Price (2020) $3.50 $6.75 $1.75arrow_forwardWhat information is given by the CPI? The CPI tells us _______. A. the price level in a given period expressed as a percentage of the price level in the base period, which equals zero B. the price level in a given period expressed as a percentage of the price level in the base period, which equals 100 C. the inflation rate in a given period compared to the inflation rate in the base period, which equals 100 D. the inflation rate in a given period compared to the inflation rate in the base period, which equals zeroarrow_forward
arrow_back_ios
arrow_forward_ios
Recommended textbooks for you

 Principles of Economics (12th Edition)EconomicsISBN:9780134078779Author:Karl E. Case, Ray C. Fair, Sharon E. OsterPublisher:PEARSON
 Engineering Economy (17th Edition)EconomicsISBN:9780134870069Author:William G. Sullivan, Elin M. Wicks, C. Patrick KoellingPublisher:PEARSON
 Principles of Economics (MindTap Course List)EconomicsISBN:9781305585126Author:N. Gregory MankiwPublisher:Cengage Learning
 Managerial Economics: A Problem Solving ApproachEconomicsISBN:9781337106665Author:Luke M. Froeb, Brian T. McCann, Michael R. Ward, Mike ShorPublisher:Cengage Learning
 Managerial Economics & Business Strategy (Mcgraw-...EconomicsISBN:9781259290619Author:Michael Baye, Jeff PrincePublisher:McGraw-Hill Education


Principles of Economics (12th Edition)
Economics
ISBN:9780134078779
Author:Karl E. Case, Ray C. Fair, Sharon E. Oster
Publisher:PEARSON

Engineering Economy (17th Edition)
Economics
ISBN:9780134870069
Author:William G. Sullivan, Elin M. Wicks, C. Patrick Koelling
Publisher:PEARSON

Principles of Economics (MindTap Course List)
Economics
ISBN:9781305585126
Author:N. Gregory Mankiw
Publisher:Cengage Learning

Managerial Economics: A Problem Solving Approach
Economics
ISBN:9781337106665
Author:Luke M. Froeb, Brian T. McCann, Michael R. Ward, Mike Shor
Publisher:Cengage Learning

Managerial Economics & Business Strategy (Mcgraw-...
Economics
ISBN:9781259290619
Author:Michael Baye, Jeff Prince
Publisher:McGraw-Hill Education