
ENGR.ECONOMIC ANALYSIS
14th Edition
ISBN: 9780190931919
Author: NEWNAN
Publisher: Oxford University Press
expand_more
expand_more
format_list_bulleted
Related questions
Concept explainers
Question
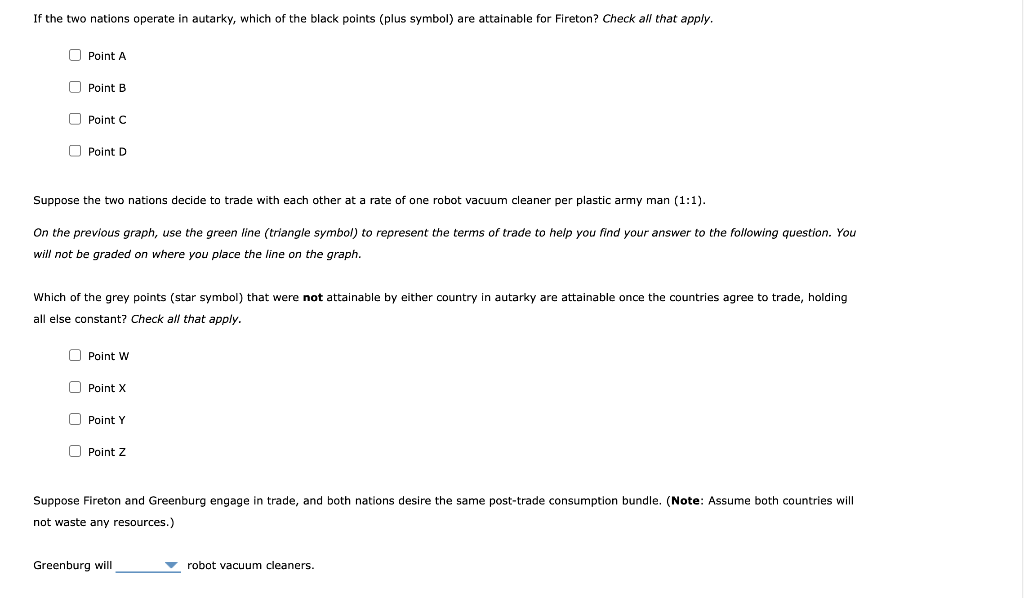

Transcribed Image Text:If the two nations operate in autarky, which of the black points (plus symbol) are attainable for Fireton? Check all that apply.
Point A
Point B
Point C
Point D
Suppose the two nations decide to trade with each other at a rate of one robot vacuum cleaner per plastic army man (1:1).
On the previous graph, use the green line (triangle symbol) to represent the terms of trade to help you find your answer to the following question. You
will not be graded on where you place the line on the graph.
Which of the grey points (star symbol) that were not attainable by either country in autarky are attainable once the countries agree to trade, holding
all else constant? Check all that apply.
Point W
Point X
Point Y
Point Z
Suppose Fireton and Greenburg engage in trade, and both nations desire the same post-trade consumption bundle. (Note: Assume both countries will
not waste any resources.)
Greenburg will
robot vacuum cleaners.

Transcribed Image Text:2. Visualizing the factor-endowment theory
Consider the two hypothetical nations of Greenburg and Fireton. Suppose they both produce only two goods, robot vacuum cleaners and plastic army
men. Each country faces a trade-off when producing the two goods. The following graph displays the respective production possibilities frontiers (PPF)
for Greenburg and Fireton.
PLASTIC ARMY MEN (Thousands)
50
45
40
35
30
25
5
0
0
Greenburg's PPF
5
C
3
x0
M
8₂
4X4
*8
Fireton's PPF
10 15 20 25 30 35 40
ROBOT VACUUM CLEANERS (Thousands)
45 50
Terms of Trade
?
Expert Solution
This question has been solved!
Explore an expertly crafted, step-by-step solution for a thorough understanding of key concepts.

This is a popular solution

Trending nowThis is a popular solution!

Step by stepSolved in 3 steps with 1 images

Knowledge Booster


Learn more about
Need a deep-dive on the concept behind this application? Look no further. Learn more about this topic, economics and related others by exploring similar questions and additional content below.Similar questions
- Suppose that there are two countries, the North and the South. Given the North's resources, it can produce 4 Cars in an hour or 1 unit of wheat in an hour. Given the South's resources, it can produce 1 car per hour or 4 units of wheat in an hour. Both countries have forty hours in total to produce wheat and cars. Finally, the goal of each country is to have the most possible cars and wheat, but also to always have an equal amount of each. In other words, 10 cars and 10 wheat is just as valuable as 11 cars and 10 units of wheat, or 10 cars and 11 units of wheat, but 11 cars and 11 wheat would make the country even better off. The question below relates to the PPF for the North and the South. While you do not need to turn in a graph of the PPF, they may be helpful to answer these questions. Finally, the first set of questions refers to a world where the North and South cannot trade, while the second set of questions refers to a world where they can trade. In the latter set of…arrow_forwardAs you may have heard, Russia decided to invade its neighbor, which has led to international condemnation (albeit not on all fronts). The EU, a former major importer of gas from Russai, went ahead with sanctions. Imagine, if you will, that the respective heads of state get together and try to negotiate a trade agreement to end sanctions. They each have three possible choices: (a) Maintain tariffs against the other nation (T); (b) Seek mediation from the WTO, which would implement an international trade agreement at a small cost (M); (c) Unilaterally remove tariffs (F). The payoff matrix is as given below. Is there a dominant strategy for either player? Find all the (pure strategy) Nash equilibria in the game. How would this change if, instead, the mediation is costless and yields a payoff of 50 to each nation (assuming mutually successful mediation) and a payoff of 0 (if the other nation chooses otherwise)? **arrow_forwardSuppose that France and Denmark both produce fish and olives. France's opportunity cost of producing a crate of olives is 3 pounds of fish while Denmark's opportunity cost of producing a crate of olives is 11 pounds of fish. By comparing the opportunity cost of producing olives in the two countries, you can tell that has a comparative advantage in the production of olives and has a comparative advantage in the production of fish. Suppose that France and Denmark consider trading olives and fish with each other. France can gain from specialization and trade as long as it receives more than of fish for each crate of olives it exports to Denmark. Similarly, Denmark can gain from trade as long as it receives more than of olives for each pound of fish it exports to France. Based on your answer to the last question, which of the following prices of trade (that is, price of olives in terms of fish) would allow both Denmark and France to gain from trade? Check…arrow_forward
- The production possibilities frontiers in the figure to the right show how many bananas and coconuts you (Y) and your neighbor (N) can consume without trade Suppose you are initially consuming 14 bananas and 3 coconuts and your neighbor is initially consuming 3 bananas and 9 coconuts. Now, suppose you and your neighbor specialize by each only producing the good for which you have a comparative advantage You give your neighbor half of your production for half of what he produces. (Enter all responses as integers) If you trade with your neighbor, then you will have additional coconut(s) after the trade and additional banana(s) At the same time, your neighbor will be able to consume additional banana(s) and will be as a result of trade. Quantity of coconuts 26- 2.*.*.*.*. Your PPF 12- 10- Neighbor's PPF 6 8 10 12 14 16 18 20 22 24 26 28 30 32 Quantity of bananas GOOarrow_forwardWhen a country has a comparative advantage in the production of a good, it means that it can produce this good at a lower opportunity cost than its trading partner. Then the country will specialize in the production of this good and trade it for other goods. The following graphs show the production possibilities frontiers (PPFs) for Glacier and Rainier. Both countries produce corn and basil, each initially (i.e., before specialization and trade) producing 18 million pounds of corn and 9 million pounds of basil, as indicated by the grey stars marked with the letter A. BASIL (Millions of pounds) 48 42 36 30 24 18 12 6 0 0 PPF 6 Glacier A 12 18 24 30 36 CORN (Millions of pounds) 42 48 ? BASIL (Millions of pounds) 48 42 36 30 24 18 12 6 0 0 PPF I + 6 Rainier 12 18 24 30 36 CORN (Millions of pounds) I 42 48 (?) Glacier has a comparative advantage in the production of while Rainier has a comparative advantage in the production of Suppose that Glacier and Rainier specialize in the production…arrow_forwardAssume that two countries Alpha and Beta use a variety of inputs in their production Alpha exports excavating equipment and imports solar cells. Assume furthermore no economies of scale. Select the correct statement from the ones below: Even though there is trade, Alpha has a lower opportunity cost for excavating If the countries did not trade, Alpha would have a lower opportunity cost for excavating Neither country can consume at a point outside its production possibility frontier. Alpha avoids producing solar cells while B avoids producing no excavatingarrow_forward
- 4.3 Suppose that Britain can produce 10 units of cloth or 5 units of food per day (or any linear combination) with available resources and that Greece can produce 2 units of food per day or 1 unit of cloth (or any combination). Britain has an absolute advantage over Greece in producing both goods. Does it still make sense for these countries to trade? Explain.arrow_forwardWhen a country specializes in the production of a good, this means that it can produce this good at a lower opportunity cost than its trading partner. Because of this comparative advantage, both countries benefit when they specialize and trade with each other. The following graphs show the production possibilities frontiers (PPFS) for Maldonia and Lamponia. Both countries produce lemons and sugar, each initially (i.e., before specialization and trade) producing 24 million pounds of lemons and 12 million pounds of sugar, as indicated by the grey stars marked with the letter A. (? (?) Maldonia Lamponia 64 64 56 56 48 PPF 48 40 40 32 32 24 24 PPF 16 16 16 24 32 40 48 56 64 16 24 32 40 48 56 64 LEMONS (Millions of pounds) LEMONS (Millions of pounds) Maldonia has a comparative advantage in the production of production of while Lamponia has a comparative advantage in the . Suppose that Maldonia and Lamponia specialize in the production of the goods in which each has a comparative advantage.…arrow_forwardAnswer the next question(s) on the basis of the following information. Assume that by devoting all its resources to the production of X, nation Alpha can produce 40 units of X. By devoting all its resources to Y, Alpha can produce 60Y. Comparable figures for nation Beta are 60X and 40Y. Refer to the above information. The terms of trade will be at or within the 1X=1¹/2Y to 1X = ²/3Y range. Select one: True Falsearrow_forward
- advantage. The countries decide to exchange 24 million pounds of peas for 24 million pounds of pistachios. This ratio of goods is known as the price of trade between Yosemite and Congaree. The following graph shows the same PPF for Yosemite as before, as well as its initial consumption at point A. Place a black point (plus symbol) on the graph to indicate Yosemite's consumption after trade. Note: Dashed drop lines will automatically extend to both axes. The following graph shows the same PPF for Congaree as before, as well as its initial consumption at point A. As you did for Yosemite, place a black point (plus symbol) on the following graph to indicate Congaree's consumption after trade.arrow_forwardWhen a country has a comparative advantage in the production of a good, it means that it can produce this good at a lower opportunity cost than its trading partner. Then the country will specialize in the production of this good and trade it for other goods. The following graphs show the production possibilities frontiers (PPFS) for Maldonia and Desonia. Both countries produce lemons and tea, each initially (i.e., before specialization and trade) producing 24 million pounds of lemons and 12 million pounds of tea, as indicated by the grey stars marked with the letter A. (2 Maldonia Desonia 64 64 56 56 48 PPF 48 40 40 32 32 24 24 PPF 16 16 8 8 8 16 24 32 40 48 56 64 8 16 24 32 40 48 56 64 LEMONS (Millions of pounds) LEMONS (Millions of pounds) TEA (Millions of pounds) TEA (Millions of pounds)arrow_forward
arrow_back_ios
arrow_forward_ios
Recommended textbooks for you
 Principles of Economics (12th Edition)EconomicsISBN:9780134078779Author:Karl E. Case, Ray C. Fair, Sharon E. OsterPublisher:PEARSON
 Engineering Economy (17th Edition)EconomicsISBN:9780134870069Author:William G. Sullivan, Elin M. Wicks, C. Patrick KoellingPublisher:PEARSON
 Principles of Economics (MindTap Course List)EconomicsISBN:9781305585126Author:N. Gregory MankiwPublisher:Cengage Learning
 Managerial Economics: A Problem Solving ApproachEconomicsISBN:9781337106665Author:Luke M. Froeb, Brian T. McCann, Michael R. Ward, Mike ShorPublisher:Cengage Learning
 Managerial Economics & Business Strategy (Mcgraw-...EconomicsISBN:9781259290619Author:Michael Baye, Jeff PrincePublisher:McGraw-Hill Education
Principles of Economics (12th Edition)
Economics
ISBN:9780134078779
Author:Karl E. Case, Ray C. Fair, Sharon E. Oster
Publisher:PEARSON
Engineering Economy (17th Edition)
Economics
ISBN:9780134870069
Author:William G. Sullivan, Elin M. Wicks, C. Patrick Koelling
Publisher:PEARSON
Principles of Economics (MindTap Course List)
Economics
ISBN:9781305585126
Author:N. Gregory Mankiw
Publisher:Cengage Learning
Managerial Economics: A Problem Solving Approach
Economics
ISBN:9781337106665
Author:Luke M. Froeb, Brian T. McCann, Michael R. Ward, Mike Shor
Publisher:Cengage Learning
Managerial Economics & Business Strategy (Mcgraw-...
Economics
ISBN:9781259290619
Author:Michael Baye, Jeff Prince
Publisher:McGraw-Hill Education