ENGR.ECONOMIC ANALYSIS
14th Edition
ISBN: 9780190931919
Author: NEWNAN
Publisher: Oxford University Press
expand_more
expand_more
format_list_bulleted
Question
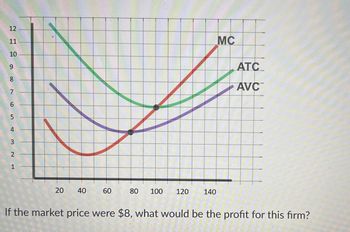
If the market
a. 120
b. 180
c. 0
d. $960

Transcribed Image Text:2 SAM NA
12
11
10
9
7
20 40
60
80 100 120
140
MC
ATC
AVC
If the market price were $8, what would be the profit for this firm?
Expert Solution
This question has been solved!
Explore an expertly crafted, step-by-step solution for a thorough understanding of key concepts.
This is a popular solution
Trending nowThis is a popular solution!
Step by stepSolved in 3 steps with 4 images

Knowledge Booster
Learn more about
Need a deep-dive on the concept behind this application? Look no further. Learn more about this topic, economics and related others by exploring similar questions and additional content below.Similar questions
- Brody's firm produces trumpets in a perfectly competitive market. The table below shows Brody's total variable cost. He has a fixed cost of $240, and the price per trumpet is $60.-Calculate the average total cost of producing 6 trumpets. Show your work. -Calculate the marginal cost of producing the 11th trumpet. -What is Brody's profit-maximizing quantity? Use marginal analysis to explain your answer. -At the profit-maximizing quantity you determined in part (c), calculate Brody's profit or loss. Show your work. -Brody also produces saxophones at a loss in a perfectly competitive market. Draw a correctly labeled graph for Brody's firm showing the following at a market price of $200. -Brody's profit-maximizing quantity of saxophones -Brody's loss, completely shaded Quantity Total Variable cost 6 $120 7 $145 8 $165 9 $220 10 $290 11 $390arrow_forwardOnly typed answer and don't use chatgptarrow_forward18 Market Representative Firm MC i of A a $7 MR = P ATC b $5 AVC $2 D1 18,000 70 100 115 Quantity (Q) Output (Q) The diagram above shows a Perfectly Competitive market on the left, and a representative firm supplying in that market on the right. In the long run we would expect the market and the Price to Select one: a. existing firms to exit; increase b. new firms to enter; increase С. new firms to enter; decrease d. existing firms to exit; decrease Price $$$arrow_forward
- why the answer is 150. Please answer correct calculation asap plz Don't answer by pen paper plzarrow_forwardA firms cost and revenue functions look like this in 3 questions below. Total cost: TC = 100 + 2Q + Q2 Marginal cost: MC = 2 + 2Q Price: P=22 What is the profit maximizing output? a. 8 b. 10 c. 12 d. 25 e. All the other answers are wrong. What is the firm's profit? a. -14 b. -6 c. 0 d. 15 e. All then other answers are wrong. What are the fixed costs and variable costs at the profit maximising output? a. FC=0, VC=220 b. FC=100, VC=80 c. FC=80, VC=244 d. FC=100, VC=120 e. All the other answers are wrong.arrow_forwardAt the marketplace $8 per bushel.....please answerarrow_forward
- Give type answerarrow_forwardThe graph below depicts the cost curves faced by all firms in a particular industry. While the second graph show the total market demand (in thousands). Initially there are 500 firms. 10 B N 5 20 40 60 80 100 120 140 160 180 200 9 50 100 150 200 250 300 350 400 450 500 Demand in thousands What is the SR profit per firm? -80 240 0300 400arrow_forwardPlease answer fast please arjent help pleasearrow_forward
- Use the figure below to answer the following questions. Price and cost (dollars per unit) 100 90 85 80 70 55 40 0 MR₂ MC ATC La MR₁ 100 140 200 220 250 Quantity (units per week) Figure 13.2.3 Refer to Figure 13.2.3. Assume this firm faces demand curve D2. If the firm produces the efficient quantity, it makes zero economic profit. makes an economic profit. will face competition from new firms entering the industry. is in a long-run equilibrium. incurs an economic loss.arrow_forwardIf marginal revenue is $9, how much output will the firm produce, and how much profit will it make? Show your calculations.arrow_forward20 12 10 0 MC ATC -MR 10 Quantity (units) Figure 11.4.1 Refer to Figure 11.4.1, which shows the cost curves and marginal revenue curve of a firm in a perfectly competitive market. In the long run, market O supply will decrease. demand will decrease. O supply and market demand will decrease. supply will increase. O demand will increase.arrow_forward
arrow_back_ios
SEE MORE QUESTIONS
arrow_forward_ios
Recommended textbooks for you

 Principles of Economics (12th Edition)EconomicsISBN:9780134078779Author:Karl E. Case, Ray C. Fair, Sharon E. OsterPublisher:PEARSON
 Engineering Economy (17th Edition)EconomicsISBN:9780134870069Author:William G. Sullivan, Elin M. Wicks, C. Patrick KoellingPublisher:PEARSON
 Principles of Economics (MindTap Course List)EconomicsISBN:9781305585126Author:N. Gregory MankiwPublisher:Cengage Learning
 Managerial Economics: A Problem Solving ApproachEconomicsISBN:9781337106665Author:Luke M. Froeb, Brian T. McCann, Michael R. Ward, Mike ShorPublisher:Cengage Learning
 Managerial Economics & Business Strategy (Mcgraw-...EconomicsISBN:9781259290619Author:Michael Baye, Jeff PrincePublisher:McGraw-Hill Education


Principles of Economics (12th Edition)
Economics
ISBN:9780134078779
Author:Karl E. Case, Ray C. Fair, Sharon E. Oster
Publisher:PEARSON

Engineering Economy (17th Edition)
Economics
ISBN:9780134870069
Author:William G. Sullivan, Elin M. Wicks, C. Patrick Koelling
Publisher:PEARSON

Principles of Economics (MindTap Course List)
Economics
ISBN:9781305585126
Author:N. Gregory Mankiw
Publisher:Cengage Learning

Managerial Economics: A Problem Solving Approach
Economics
ISBN:9781337106665
Author:Luke M. Froeb, Brian T. McCann, Michael R. Ward, Mike Shor
Publisher:Cengage Learning

Managerial Economics & Business Strategy (Mcgraw-...
Economics
ISBN:9781259290619
Author:Michael Baye, Jeff Prince
Publisher:McGraw-Hill Education