
MATLAB: An Introduction with Applications
6th Edition
ISBN: 9781119256830
Author: Amos Gilat
Publisher: John Wiley & Sons Inc
expand_more
expand_more
format_list_bulleted
Related questions
Question
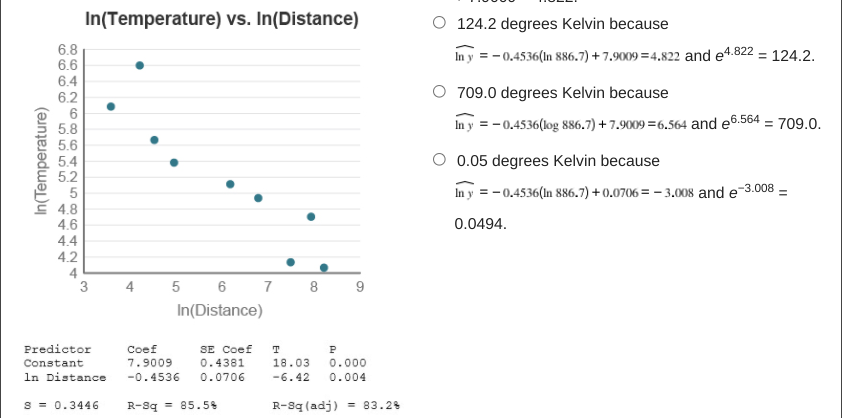
How is the distance from the sun for planets in our solar system related to the mean temperature of each planet? To find out, a
Based on the scatterplot and computer output, a reasonable estimate of mean temperature in Kelvin for Saturn, which is 886.7 million miles away from the sun is:
4.822 degrees Kelvin because ŷ = −0.4536(In 886.7) + 7.9009 = 4.822.
124.2 degrees Kelvin because and e4.822 = 124.2.
709.0 degrees Kelvin because and e6.564 = 709.0.
0.05 degrees Kelvin because and e−3.008 = 0.0494.

Transcribed Image Text:In(Temperature) vs. In(Distance)
O 124.2 degrees Kelvin because
6.8
6.6
6.4
6.2
In y = - 0.4536(In 886.7) + 7.9009 =4.822 and e4.822 = 124.2.
709.0 degrees Kelvin because
6
5.8
5.6
5.4
5.2
In y = - 0.4536(log 886.7) + 7.9009 =6.564 and e6.564 = 709.0.
O 0.05 degrees Kelvin because
In y = - 0.4536(In 886.7) + 0.0706 = – 3.008 and e-3.008 =
4.8
4.6
4.4
4.2
0.0494.
4
5 6
7
8
9
In(Distance)
SE Coef
0.4381
0.0706
Predictor
Coef
T
P
Constant
7.9009
18.03
0.000
In Distance
-0.4536
-6.42
0.004
S = 0.3446
R-Sq = 85.5
R-Sq (adj) = 83.2%
8642 Ooo4 250o 424
5555
444
In(Temperature)
Expert Solution
This question has been solved!
Explore an expertly crafted, step-by-step solution for a thorough understanding of key concepts.

This is a popular solution

Trending nowThis is a popular solution!

Step by stepSolved in 2 steps with 2 images

Knowledge Booster

Similar questions
- Please answer Question 9.arrow_forwardA certain forest covers an area of 4100 km². Suppose that each year this area decreases by 7%. What will the area be after 10 years? Use the calculator provided and round your answer to the nearest square kilometer. 2 km² X ?arrow_forwardFor items 1 - 5, use the data below that gives the humerus bone length (in cm) and height (in inches) for a sample of female skeletons. [The data was provided by Dr. Ayers-Darling, former professor at MVCC.] humerus (cm) height (in.) 32.6 66 28.0 60 29.9 62 30.5 63 31.2 64 29.9 62 29.1 61 29.5 62 29.8 62 28.5 The least-squares regression line relating two variables x and y is given by . Compute the residual if the actual value of y is 8 when x is 2.____________________________ Let's visit the scuba diver data again. The least-squares regression equation for the data is dive time = 73.367 0.426(max depth). Predict the dive time, if the maximum depth is 60 feet. Express your answer to the nearest minute (whole number).________ Let's visit the scuba diver data again. The least-squares regression equation for the data is dive time = 73.367 0.426(max depth). Predict the dive time, if the diver remains on the surface of the water (maximum depth is 0 feet). Express…arrow_forward
- The numbers of polio cases in the world are shown in the table for various years. Year Number of Polio Cases (thousands) 1988 1992 1996 2000 2005 2007 350 138 36 5 3.2 1.3 Let f(t) be the number of polio cases (in thousands) t years after 1980. Copy the data to Desmos to draw a scatterplot of the data. Make sure to adjust the years so they represent years after 1980. a) Is it better to model the data with a linear or with an exponential model? [Select an answer b) Use regression in Desmos to find an appropriate model for f. Make sure to check Log mode in the parameter window in Desmos if you are fitting an exponential model. f(t) Round the coefficients to 4 decimal places. Hint: Use the variable t from the drop down menu when entering the equation. Do not just type in t. c) Predict the number of polio cases in 2014. d) Find the approximate half-life of the number of polio cases. Round the answer to one decimal place. yearsarrow_forward1. Complete the following in regard to the hair color category of the data set: a. In the region to the right, make an appropriately labeled frequency table in regard ONLY to the hair color data (for this portion, ignore all other variables in the data set except hair color). Next, extend the frequency table to include a relative frequency column. Use a fill handle to create the relative frequency column. Finally, create a bar chart graphic (NOT a histogram) from the frequency table, complete with title and labeled axes. Brown Red Brown Brown Brown Brown Blonde Brown Brown Brown Black Blonde Brown Brown Brown Brown Brown Brown Red Brown Brown Red Blonde Brown Brown Brown Brown Blonde Brown Brown Purple Black Blonde Blonde Blonde Black Brown Blonde Black Red Brown Brown Brown Brown Brown Black Red Blonde Brown Brown Blonde Brown Brown Black Blonde Brown Brown Brown…arrow_forwardTardigrades, or water bears, are a type of micro-animal famous for their resilience. In examining the effects of radiation on organisms, an expert claimed that the amount of gamma radiation needed to sterilize a colony of tardigrades no longer has a mean of 1150 Gy (grays). (For comparison, humans cannot withstand more than 10 Gy.) A random sample of 25 tardigrade colonies found that the amount of gamma radiation needed to sterilize a colony had a sample mean of 1133 Gy, with a sample standard deviation of 02 Gy. Assume that the population of amounts of gamma radiation needed to sterilize a colony of tardigrades is appraximately normally distributed. Complete the parts below to perform a hypothesis test to see if there is enough evidence, at the 0.05 level af significance, to support that H, the mean amount of gamma radiation needed to sterilize a colony of tardigrades, is not equal to 1150 Cy. (a) State the null hypothesis H, and the alternative hypothesis H, that you would use for…arrow_forward
- Please answer Question 8.arrow_forwardThe numbers of polio cases in the world are shown in the table for various years. Year Number of Polio Cases (thousands) 1988 1992 1996 2000 2005 2007 350 138 32 6 3.2 1.3 Let f(t) be the number of polio cases (in thousands) t years after 1980. Copy the data to Desmos to draw a scatterplot of the data. Make sure to adjust the years so they represent years after 1980. a) Is it better to model the data with a linear or with an exponential model? Select an answer b) Use regression in Desmos to find an appropriate model for f. Make sure to check Log mode in the parameter window in Desmos if you are fitting an exponential model. f(t) places. Round the coefficients to 4 decimal Hint: Use the variable t from the drop down menu when entering the equation. Do not just type in t. c) Predict the number of polio cases in 2019. d) Find the approximate half-life of the number of polio cases. Round the answer to one decimal place. yearsarrow_forwardJim Albert compiled data about every pitch thrown by 20 starting pitchers during the 2009 MLB season. The data set included the type of pitch thrown (curveball, changeup, slider, etc.) as well as the speed of the ball as it left the pitcher's hand. A histogram of speeds for all 30,740 four-seam fastballs thrown by these pitchers during the 2009 season is shown below, from which we can see that the speeds of these fastballs follow a Normal model with mean u = 92.12 mph and a standard deviation of o = 2.43 mph. 85 90 95 100 speed (mph) Compute the z-score of pitch with speed 99 mph. (Round your answer to two decimal places.) Approximately what fraction of these four-seam fastballs would you expect to have speeds between 91.7 mph and 96.3 mph? (Express your answer as a decimal, not a percent, and round to three decimal places.) Approximately what fraction of these four-seam fastballs would you expect to have speeds above 96.3 mph? (Express your answer as a decimal, not a percent, and…arrow_forward
- Question #9arrow_forwardThe table shows information from a survey about the resting heart rate in beats per minute (bpm), for 200 college students who are in the marching band and who are not in the marching band. Beats/Minute below 80 bpmabove 80 bpm total in the marching band 56 28 84 not in the marching band 66 50 116 total 122 78 200 1. Create a two-way table that shows the relative frequency for each of the values in the table relative to all 200 people in the survey. 2. What is the probability that a person surveyed, selected at random, has a heart rate above 80 bpm or is in the marching band? 3. What is the probability that a person surveyed, selected at random, has a heart rate below 80 bpm and is not in the marching band?arrow_forwardAn insurance investigator has observed that people with some astrological signs tend to be safer drivers than people with other signs. Using insurance records, the investigator classified 150 people according to their astrological signs and whether or not they were involved in a car accident during the previous 12 months. Do the following data indicate a significant relationship between sign and accidents? Test with a = .05. Libra Leo Gemini Accident 7 4 19 No Accident 73 46 1arrow_forward
arrow_back_ios
SEE MORE QUESTIONS
arrow_forward_ios
Recommended textbooks for you
- MATLAB: An Introduction with ApplicationsStatisticsISBN:9781119256830Author:Amos GilatPublisher:John Wiley & Sons Inc
 Probability and Statistics for Engineering and th...StatisticsISBN:9781305251809Author:Jay L. DevorePublisher:Cengage Learning
 Statistics for The Behavioral Sciences (MindTap C...StatisticsISBN:9781305504912Author:Frederick J Gravetter, Larry B. WallnauPublisher:Cengage Learning
  Elementary Statistics: Picturing the World (7th E...StatisticsISBN:9780134683416Author:Ron Larson, Betsy FarberPublisher:PEARSON
 The Basic Practice of StatisticsStatisticsISBN:9781319042578Author:David S. Moore, William I. Notz, Michael A. FlignerPublisher:W. H. Freeman
 Introduction to the Practice of StatisticsStatisticsISBN:9781319013387Author:David S. Moore, George P. McCabe, Bruce A. CraigPublisher:W. H. Freeman
MATLAB: An Introduction with Applications
Statistics
ISBN:9781119256830
Author:Amos Gilat
Publisher:John Wiley & Sons Inc
Probability and Statistics for Engineering and th...
Statistics
ISBN:9781305251809
Author:Jay L. Devore
Publisher:Cengage Learning
Statistics for The Behavioral Sciences (MindTap C...
Statistics
ISBN:9781305504912
Author:Frederick J Gravetter, Larry B. Wallnau
Publisher:Cengage Learning
Elementary Statistics: Picturing the World (7th E...
Statistics
ISBN:9780134683416
Author:Ron Larson, Betsy Farber
Publisher:PEARSON
The Basic Practice of Statistics
Statistics
ISBN:9781319042578
Author:David S. Moore, William I. Notz, Michael A. Fligner
Publisher:W. H. Freeman
Introduction to the Practice of Statistics
Statistics
ISBN:9781319013387
Author:David S. Moore, George P. McCabe, Bruce A. Craig
Publisher:W. H. Freeman