Practical Management Science
6th Edition
ISBN: 9781337406659
Author: WINSTON, Wayne L.
Publisher: Cengage,
expand_more
expand_more
format_list_bulleted
Question
9.2
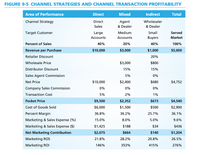
- How does the net marketing contribution and marketing
ROI change if the business modifies its sales mix to 30% direct sales, 40% agent distributor, and 30% distributor retailer? - How does the net marketing contribution and marketing ROI change if the business replaces the direct sales channel with the agent-distributor channel, with a sales mix of 60% agent distributor and 40% distributor retailer?

Transcribed Image Text:FIGURE 9-5 CHANNEL STRATEGIES AND CHANNEL TRANSACTION PROFITABILITY
Area of Performance
Direct
Mixed
Indirect
Total
Channel Strategy
Direct
Agent
Wholesaler
Sales
& Dealer
& Dealer
Target Customer
Large
Medium
Small
Served
Accounts
Accounts
Buyers
Market
Percent of Sales
40%
20%
40%
100%
Revenue per Purchase
$10,000
$3,000
$1,000
$5,000
Retailer Discount
20%
Wholesale Price
$3,000
$800
Distributor Discount
15%
15%
Sales Agent Commission
5%
0%
Net Price
$10,000
$2,400
$680
$4,752
Company Sales Commission
0%
0%
0%
Transaction Cost
5%
2%
1%
Pocket Price
$9,500
$2,352
$673
$4,540
Cost of Goods Sold
$6,000
$1,500
$500
$2,900
Percent Margin
36.8%
36.2%
25.7%
36.1%
Marketing & Sales Expense (%)
15.0%
8.0%
5.0%
9.6%
Marketing & Sales Expense ($)
$1,425
$188
$34
$436
Net Marketing Contribution
$2,075
$664
$140
$1,204
Marketing ROS
21.8%
28.2%
20.8%
26.5%
Marketing ROI
146%
353%
415%
276%
Expert Solution
This question has been solved!
Explore an expertly crafted, step-by-step solution for a thorough understanding of key concepts.
This is a popular solution
Trending nowThis is a popular solution!
Step by stepSolved in 2 steps

Knowledge Booster
Learn more about
Need a deep-dive on the concept behind this application? Look no further. Learn more about this topic, operations-management and related others by exploring similar questions and additional content below.Similar questions
- What is a possible reason a firm might go direct-to-consumer (DTC)?arrow_forward"MY BUYER PERSONA" In this activity, you are going to create a BUYER PERSONA for Apple Inc. A buyer persona sample question is provided below for you to follow. A buyer persona is a description of a semi-fictional character that represents an ideal customer for a certain business. It is a detailed summary of the characteristics, qualities, and habits of a person who is part of the target market.arrow_forwardPlease Help ASAP!!!arrow_forward
- Please help with these 3 questions ASAP. Very simple answer needed and no word limit.arrow_forwardWith a company only considering extra small, and small size to the clothing it sells. What should be the end matter and supplementary material of this company?arrow_forwardHow can an indirect buyer effectively use performance-based logistics or service-levelagreements to control the costs of procuring services?arrow_forward
- Please explain the make and buy attached to the picture, and thank you very much ....arrow_forwardComment on this statement: “The only distinctionamong merchant wholesalers and agents and bro-kers is that merchant wholesalers take title to theproducts they sell.”arrow_forwardWhat is a good marketing plan for a medical transportation company around the unique Selling proposition.Proposition. what should the company USP bearrow_forward
- Briefly explain each of the following e-commerce revenue models by highlighting differences, ( if any) a) Advertising revenue model b) Subscription revenue model c) Transaction fee revenue modelarrow_forwardSelect a service company and analyse 4 important questions you need to consider before applying distribution strategies. (200-300 Words)arrow_forwardThe wheel of retailing mentions three phases for retail life cycle. The retailer attempts to up market location, offer exotic services, and elaborate facilities in_____stage. A.Vulnerability B.Trading up C.Entry D.Maturityarrow_forward
arrow_back_ios
SEE MORE QUESTIONS
arrow_forward_ios
Recommended textbooks for you
 Practical Management ScienceOperations ManagementISBN:9781337406659Author:WINSTON, Wayne L.Publisher:Cengage,
 Operations ManagementOperations ManagementISBN:9781259667473Author:William J StevensonPublisher:McGraw-Hill Education
 Operations and Supply Chain Management (Mcgraw-hi...Operations ManagementISBN:9781259666100Author:F. Robert Jacobs, Richard B ChasePublisher:McGraw-Hill Education
 Purchasing and Supply Chain ManagementOperations ManagementISBN:9781285869681Author:Robert M. Monczka, Robert B. Handfield, Larry C. Giunipero, James L. PattersonPublisher:Cengage Learning
 Production and Operations Analysis, Seventh Editi...Operations ManagementISBN:9781478623069Author:Steven Nahmias, Tava Lennon OlsenPublisher:Waveland Press, Inc.

Practical Management Science
Operations Management
ISBN:9781337406659
Author:WINSTON, Wayne L.
Publisher:Cengage,

Operations Management
Operations Management
ISBN:9781259667473
Author:William J Stevenson
Publisher:McGraw-Hill Education

Operations and Supply Chain Management (Mcgraw-hi...
Operations Management
ISBN:9781259666100
Author:F. Robert Jacobs, Richard B Chase
Publisher:McGraw-Hill Education


Purchasing and Supply Chain Management
Operations Management
ISBN:9781285869681
Author:Robert M. Monczka, Robert B. Handfield, Larry C. Giunipero, James L. Patterson
Publisher:Cengage Learning

Production and Operations Analysis, Seventh Editi...
Operations Management
ISBN:9781478623069
Author:Steven Nahmias, Tava Lennon Olsen
Publisher:Waveland Press, Inc.