MATLAB: An Introduction with Applications
6th Edition
ISBN: 9781119256830
Author: Amos Gilat
Publisher: John Wiley & Sons Inc
expand_more
expand_more
format_list_bulleted
Question

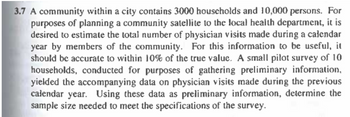
Transcribed Image Text:3.7 A community within a city contains 3000 households and 10,000 persons. For
purposes of planning a community satellite to the local health department, it is
desired to estimate the total number of physician visits made during a calendar
year by members of the community. For this information to be useful, it
should be accurate to within 10% of the true value. A small pilot survey of 10
households, conducted for purposes of gathering preliminary information,
yielded the accompanying data on physician visits made during the previous
calendar year. Using these data as preliminary information, determine the
sample size needed to meet the specifications of the survey.

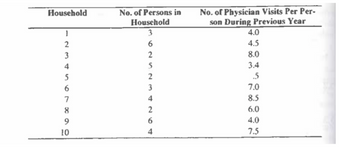
Transcribed Image Text:Household
1
2
3
4
5
6
7
860
9
10
No. of Persons in
Household
3
6
2
5
2
426 WI
3
4
No. of Physician Visits Per Per-
son During Previous Year
4.0
4.5
8.0
3.4
.5
7.0
8.5
6.0
4.0
7.5
Expert Solution
This question has been solved!
Explore an expertly crafted, step-by-step solution for a thorough understanding of key concepts.
Step by stepSolved in 3 steps with 1 images

Knowledge Booster
Similar questions
- 212 File. A Ener AQuiz G dom Serie К Вasi G Calc Laur - Laur nihg.com/web/viewer.html?state%=%7B"ids"%3A%5B"1aUZoUz1sWs-64hiqEhm7Cuq7CGJtKaXi"%5D%2C"from"%3A" A Atherosclorosis O science project 8th.. E Tobiloba Aderemi -. SClever logo 3 ConnectEdSingle si.. A Algebra 1 Peri.. Rosetta Robertson - Q2 Quiz 1 Study Guide 1. Find a reasonable domain and range for the function. Then graph the function. A car can travel 31 mi for each gailon of gasoline. The function d(x) = 31x represents the distance d(x), in miles, that the car can travel with x gallons of gasonline. The car's fuel tank holds 14 galt. Choose the correct domain below. A. OSXS31 B. Osxs14 O c. 14sxS 31 D. Osxs434 Choose the correct range below. OA OSdix) S 14 B. 14 s d(x)s31 OC. 14sdix) s 434 OD. Osdx)S 434 Choose the correct graph below OA. B. C. D. 600 6004 Galons dalra Galons xarrow_forwardcalculate the geometric mean of the annual hpr and hpyarrow_forwardW W for 50 different cell phones. Find the percentile corresponding to 0.77 kg kg Use the accompanying radiation levels in Click the icon to view the radiation levels. W The percentile corresponding to 0.77 is kgarrow_forward
- Town Date time Temp. max Temp. min temp Feels like max Feels like min Feels like dew London 2022-07-07 23.3 16.7 19.5 23.3 16.7 19.5 11.5 London 2022-07-08 26.9 15 21.2 26.7 15 21.2 12.4 London 2022-07-09 25 15.9 20.6 25 15.9 20.6 11.4 London 2022-07-10 26.6 14.7 20.8 26.6 14.7 20.8 12.3 London 2022-07-11 29 16.4 22.8 28.2 16.4 22.7 12.5 London 2022-07-12 30.1 18.4 23.9 28.6 18.4 23.6 12.2 London 2022-07-13 26.5 17.3 20.9 26.5 17.3 20.9 14.3 London 2022-07-14 23.5 12 17.7 23.5 12 17.7 7.4 London 2022-07-15 24.6 13.4 18.4 24.6 13.4 18.4 8.8 London 2022-07-16 30 13.6 21.7 29.4 13.6 21.5 11.7 London 2022-07-17 25.9 13.7 19.5 25.9 13.7 19.5 9.4 For the data above , use the linear forecasting model which is y = mx + c to calculate and discuss…arrow_forwardelearn.squ.edu.om YSTEM (ACADEMIC) SS STATISTICS I- Spring21 Time left The appropriate Interval width for a random sample of 100 observations that fall between 50 and 250 Is O A. 10 O B. 15 O C. 20 O D. 25 GE NEXTarrow_forwardAT-201-CA03 son.com/Student/PlayerHomework.aspx?homeworkld=639481068&questionid=9&flushed=false&cid=7219024&back=https://mylab.pearson..... ☆ cing a population mean K ch PT Do Homev X A HW Score: 33.2%, 8.3 of 25 points O Points: 0 of 1 Here are summary statistics for randomly selected weights of newborn girls: n=36, x=3150.0 g, s= 695.5 g. Use a confidence level of 95% to complete parts (a) through (d) below. iew an example Get more help - ta/2 (Round to two decimal places as needed.) a. Identify the critical value ta/2 used for finding the margin of error. Question 2, 7.2.5-T Part 1 of 4 Xw Starasia Sinor 04/18/23 11:28 PM > Clear all Earnings upcoming Save cccccccc Check answer 11:28 PM 4/18/2023arrow_forward
- Sketch the region enclosed by the given curves. Decide whether to integrate with respect to x or y. Draw a typical approximating rectangle. y = 4x, y = 7x2 y y 2.5 0.1 0.2 0.3 0.4 0.5 0.6 2.0 -0.5- 1.5 -1.0 1.0 -1.5 0.5 -2.0 0.5 O -2.5- 0.1 0.2 0.3 0.4 0.6 y 2.5 0.2 0.3 0.4 0.5 0.6 2.0-arrow_forwardnumber of fruits spoiled frequency 0 3 1 14 2 11 3 9 4 9 5 2 6 2 7 3 14 1 25 1 build a steam and leaf chart with the information abovearrow_forwardx y 1.0 3.6 2.0 4.1 3.0 3.6 4.0 5.3 5.0 4.4 6.0 6.8 7.0 5.7 8.0 7.8 9.0 6.7 10.0 7.8 y 1 2 3 4 5 6 7 8 9 10 11 x 1 2 3 4 5 6 7 8 9 10 11 0 Figure 1 u v 1.0 7.8 2.0 8.7 3.0 6.8 4.0 5.6 5.0 8.3 6.0 5.2 7.0 4.2 8.0 7.0 9.0 6.1 10.0 3.5 v 1 2 3 4 5 6 7 8 9 10 11 u 1 2 3 4 5 6 7 8 9 10 11 0 Figure 2 w t 1.0 6.9 2.0 9.5 3.0 3.8 4.0 9.0 5.0 5.0 6.0 2.3 7.0 5.9 8.0 10.2 9.0 4.8 10.0 7.6 t 1 2 3 4 5 6 7 8 9 10 11 w 1 2 3 4 5 6 7 8 9 10 11 0 Figure 3 m n 1.0 7.8 2.0 7.1 3.0 8.0 4.0 5.9 5.0 7.4 6.0 4.5 7.0 5.2 8.0 3.7 9.0 4.1 10.0 3.5 n 1 2 3 4 5 6 7 8 9 10 11 m 1 2…arrow_forward
- Can someone help me with this? Thanks!arrow_forwardObservationFemale Married Loan 1 2 3 4 5 0.75 0.25 0.5 1 O 0.33 0 1 1 1 0 1 1 1 1 0 1 1 0 Mortgage 0 1 Calculate the Jaccard coefficient between Observation 1 and Observation 5. 0 0 1 0arrow_forwardTown Date time Temp. max Temp. min temp Feels like max Feels like min Feels like dew London 2022-07-07 23.3 16.7 19.5 23.3 16.7 19.5 11.5 London 2022-07-08 26.9 15 21.2 26.7 15 21.2 12.4 London 2022-07-09 25 15.9 20.6 25 15.9 20.6 11.4 London 2022-07-10 26.6 14.7 20.8 26.6 14.7 20.8 12.3 London 2022-07-11 29 16.4 22.8 28.2 16.4 22.7 12.5 London 2022-07-12 30.1 18.4 23.9 28.6 18.4 23.6 12.2 London 2022-07-13 26.5 17.3 20.9 26.5 17.3 20.9 14.3 London 2022-07-14 23.5 12 17.7 23.5 12 17.7 7.4 London 2022-07-15 24.6 13.4 18.4 24.6 13.4 18.4 8.8 London 2022-07-16 30 13.6 21.7 29.4 13.6 21.5 11.7 London 2022-07-17 25.9 13.7 19.5 25.9 13.7 19.5 9.4 From the data/table above Calculate and discuss** the followings. Please provide the steps for the calculation…arrow_forward
arrow_back_ios
SEE MORE QUESTIONS
arrow_forward_ios
Recommended textbooks for you
 MATLAB: An Introduction with ApplicationsStatisticsISBN:9781119256830Author:Amos GilatPublisher:John Wiley & Sons Inc
 Probability and Statistics for Engineering and th...StatisticsISBN:9781305251809Author:Jay L. DevorePublisher:Cengage Learning
 Statistics for The Behavioral Sciences (MindTap C...StatisticsISBN:9781305504912Author:Frederick J Gravetter, Larry B. WallnauPublisher:Cengage Learning
 Elementary Statistics: Picturing the World (7th E...StatisticsISBN:9780134683416Author:Ron Larson, Betsy FarberPublisher:PEARSON
 The Basic Practice of StatisticsStatisticsISBN:9781319042578Author:David S. Moore, William I. Notz, Michael A. FlignerPublisher:W. H. Freeman
 Introduction to the Practice of StatisticsStatisticsISBN:9781319013387Author:David S. Moore, George P. McCabe, Bruce A. CraigPublisher:W. H. Freeman

MATLAB: An Introduction with Applications
Statistics
ISBN:9781119256830
Author:Amos Gilat
Publisher:John Wiley & Sons Inc

Probability and Statistics for Engineering and th...
Statistics
ISBN:9781305251809
Author:Jay L. Devore
Publisher:Cengage Learning

Statistics for The Behavioral Sciences (MindTap C...
Statistics
ISBN:9781305504912
Author:Frederick J Gravetter, Larry B. Wallnau
Publisher:Cengage Learning

Elementary Statistics: Picturing the World (7th E...
Statistics
ISBN:9780134683416
Author:Ron Larson, Betsy Farber
Publisher:PEARSON

The Basic Practice of Statistics
Statistics
ISBN:9781319042578
Author:David S. Moore, William I. Notz, Michael A. Fligner
Publisher:W. H. Freeman

Introduction to the Practice of Statistics
Statistics
ISBN:9781319013387
Author:David S. Moore, George P. McCabe, Bruce A. Craig
Publisher:W. H. Freeman