
Principles of Economics 2e
2nd Edition
ISBN: 9781947172364
Author: Steven A. Greenlaw; David Shapiro
Publisher: OpenStax
expand_more
expand_more
format_list_bulleted
Related questions
Question
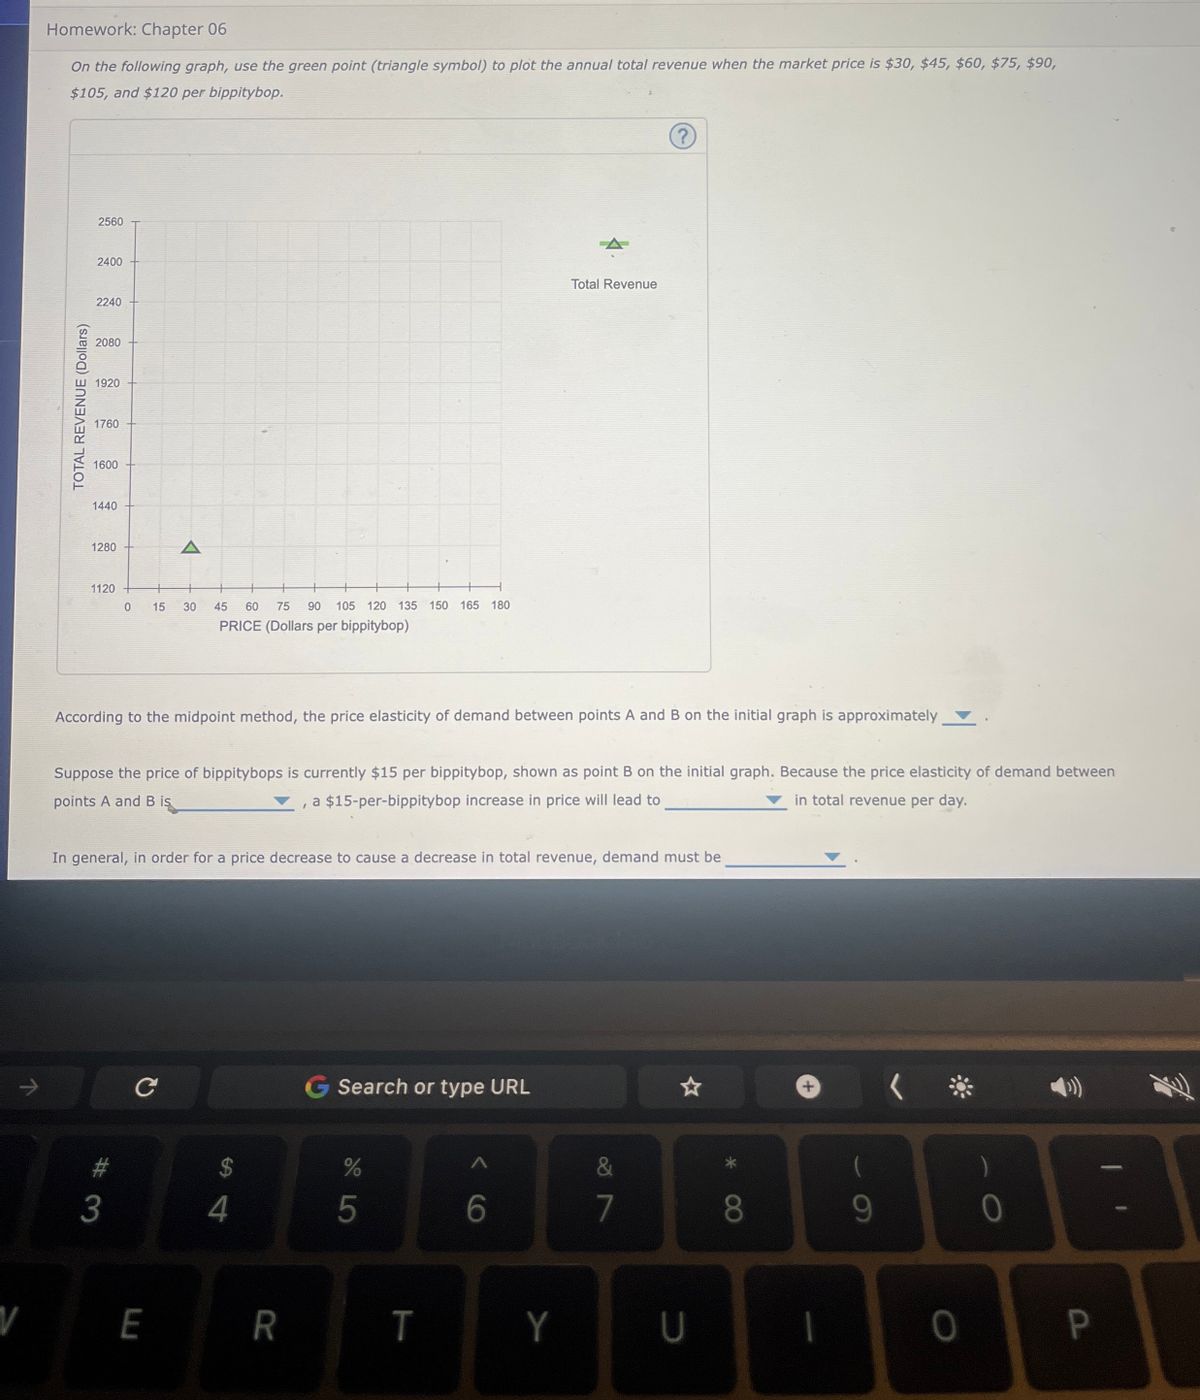

Transcribed Image Text:Homework: Chapter 06
On the following graph, use the green point (triangle symbol) to plot the annual total revenue when the market price is $30, $45, $60, $75, $90,
$105, and $120 per bippitybop.
TOTAL REVENUE (Dollars)
2560
2400
2240
2080
1920
1760
1600
1440
1280
A
1120
0
15
30
45 60 75 90 105 120 135 150 165 180
PRICE (Dollars per bippitybop)
Total Revenue
According to the midpoint method, the price elasticity of demand between points A and B on the initial graph is approximately ▾
Suppose the price of bippitybops is currently $15 per bippitybop, shown as point B on the initial graph. Because the price elasticity of demand between
points A and B is
, a $15-per-bippitybop increase in price will lead to
in total revenue per day.
In general, in order for a price decrease to cause a decrease in total revenue, demand must be
#3
C
G Search or type URL
$
4
%
45
E
R
T
&
*
(
6
7
8
9
0
Y U
0
P
Expert Solution
This question has been solved!
Explore an expertly crafted, step-by-step solution for a thorough understanding of key concepts.

Step by stepSolved in 2 steps

Knowledge Booster

Similar questions
- 6. Elasticity and total revenue The following graph shows the daily demand curve for bikes in Chicago. Use the green rectangle (triangle symbols) to compute total revenue at various prices along the demand curve. Note: You will not be graded on any changes made to this graph. 120 110 Total Revenue 100 90 80 70 60 40 A 30 20 10 Demand 16 24 32 40 48 56 64 72 80 88 96 QUANTITY (Bikes) PRICE (Dollars per bike) 50arrow_forward6. Elasticity and total revenue The following graph shows the daily demand curve for bikes in Denver. Use the green rectangle (triangle symbols) to compute total revenue at various prices along the demand curve. Note: You will not be graded on any changes made to this graph. 2 Total Revenue PRICE (Dollars per bike) 88NR S 89 88 89 O 300 275 18 27 35 45 54 53 72 QUANTITY (Bikes) 91 Demand 90 99 108arrow_forwardPRICE (Dollars per bippitybop) 282 283 2 120 110 100 90 80 70 50 30 20 10 0 X8 05 10 15 20 25 30 35 40 QUANTITY (Bippitybops) Demand 45 50 55 60 Total Revenue On the following graph, use the green point (triangle symbol) to plot the annual total revenue when the market price is $20, $30, $40, $50, $60, $70, and $80 per bippitybop.arrow_forward
- Typed plzzz and asap Thanksarrow_forwardRefer to the figure, Price (dollars) 600 550 500 450 400 350 300 250 200 150 100 50 0 Market for Game Consoles S 10 20 30 40 50 60 70 80 90 100110 Quantity Toola DL 0 O Use the graph to show the area representing the deadweight loss, and then determine the deadweight loss created as a result of setting the price at $150. Instructions: Use the tool provided "DL to illustrate this area on the graph. Deadweight loss: $arrow_forward60 50 A1 40 A A2 30 20 B C A3 10 D E F 0 05 10 15 20 25 30 35 40 45 50 55 60 Quantity Image Description: A graph, the horizontal axis labeled Quantity and the vertical labeled Price, with a straight downward-sloped line with 3 labeled points. Point A1 is at (10,40), A2 is at (15,30), a3 is at (25,10). Dotted lines extend to the axis from each point, forming rectangles which are each labeled A through F from top to bottom. The upper most region A encompasses the Price values of 30 to 40 and the Quantity values of 0 to 10. The second row of boxes, B and C, encompass the Price values of 10 to 30. B covers the quantity values of 0 to 10, and C covers the quantity values of 10 to 15. The lowest three boxes cover price values from 0 to 10. D encompasses quantity values 0 to 10, E 10 to 15, and F 15 to 25. Refer to the graph above. Area F is larger than areas B and C, because demand is elastic between $10 and $30 smaller than areas B and C, because demand is inelastic between $10 and $30…arrow_forward
- PRICE (Yen per gram) 100 90 80 70 60 40 30 20 10 0 0 0 Demand + 20 40 60 80 100 120 140 160 180 200 QUANTITY (grams of uff per month) Graph Input Tool Demand for Uff Price of Uff (Yen per gram) to eat my uff this morning, but there wasn't any Quantity Demanded DEMAND SHIFTERS Average Income -(Yen per month) Price of Tulg (Yen per gram) Price of Snick (Yen per gram) Of Suppose that the price of a gram of uff decreased from 50 yen to 40 yen. This would cause a an increase in 50 100 100 20 50 Plug any value lower than the current number into the Average Income box. A decrease in average income causes a leftward the demand curve. the demand curve and therefore When the prices of tulg or snick change, there is a shift of the demand curve for uff. The directions of these changes imply that snick and uff are , and that tulg and uff are . For example, a Hermetian might say, "I went in my fridge. So instead of having uff for breakfast, I ate somearrow_forwardJskxokdarrow_forwardSuppose that the demand and supply schedules for raisins in South Carolina are as fallows, quantitiesare measured in millions of packs per month. What is the quantity of raisins bought if the price is 50cents ? Price (cents per pack) Quantity demanded20 18030 16040 14050 12060 10070 8080 60 a) 120b) 180c) 100arrow_forward
arrow_back_ios
SEE MORE QUESTIONS
arrow_forward_ios
Recommended textbooks for you
- Principles of Economics 2eEconomicsISBN:9781947172364Author:Steven A. Greenlaw; David ShapiroPublisher:OpenStax
 Essentials of Economics (MindTap Course List)EconomicsISBN:9781337091992Author:N. Gregory MankiwPublisher:Cengage Learning
Principles of Economics 2e
Economics
ISBN:9781947172364
Author:Steven A. Greenlaw; David Shapiro
Publisher:OpenStax
Essentials of Economics (MindTap Course List)
Economics
ISBN:9781337091992
Author:N. Gregory Mankiw
Publisher:Cengage Learning