
Economics:
10th Edition
ISBN: 9781285859460
Author: BOYES, William
Publisher: Cengage Learning
expand_more
expand_more
format_list_bulleted
Related questions
Question
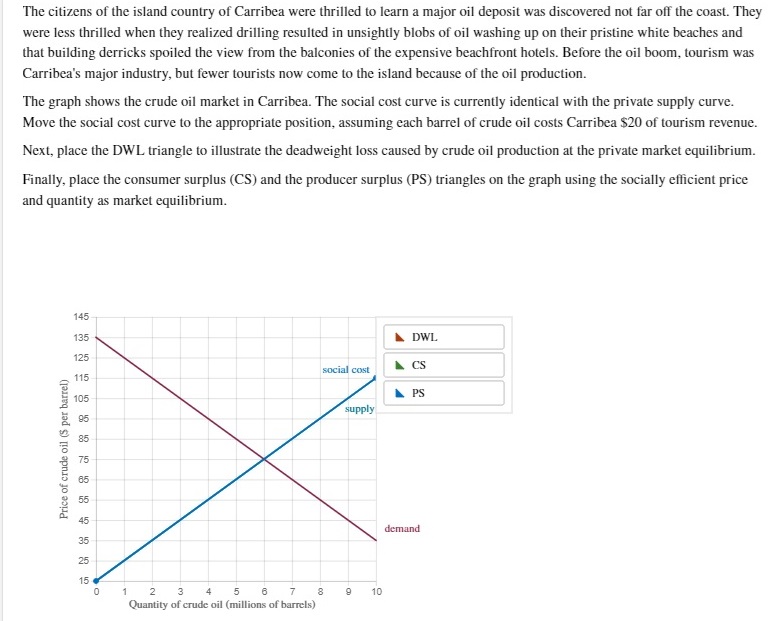

Transcribed Image Text:The citizens of the island country of Carribea were thrilled to learn a major oil deposit was discovered not far off the coast. They
were less thrilled when they realized drilling resulted in unsightly blobs of oil washing up on their pristine white beaches and
that building derricks spoiled the view from the balconies of the expensive beachfront hotels. Before the oil boom, tourism was
Carribea's major industry, but fewer tourists now come to the island because of the oil production.
The graph shows the crude oil market in Carribea. The social cost curve is currently identical with the private supply curve.
Move the social cost curve to the appropriate position, assuming each barrel of crude oil costs Carribea $20 of tourism revenue.
Next, place the DWL triangle to illustrate the deadweight loss caused by crude oil production at the private market equilibrium.
Finally, place the consumer surplus (CS) and the producer surplus (PS) triangles on the graph using the socially efficient price
and quantity as market equilibrium.
Price of crude oil ($ per barrel)
145
135
▲ DWL
125
social cost
▲ CS
115
▲ PS
105
supply
95
85
75
65
55
45
8 2 2 2 2 988
35
25
15
0
1
2
3
4
5 6
7
8
9
10
Quantity of crude oil (millions of barrels)
demand
Expert Solution
This question has been solved!
Explore an expertly crafted, step-by-step solution for a thorough understanding of key concepts.

Step by stepSolved in 2 steps with 1 images

Knowledge Booster

Similar questions
- Can you think of ways that globalization has helped you economically? Can you think of ways that it has not?arrow_forwardIn what ways (it) company investments in research and development create positive externalities?arrow_forwardWhat are some examples of innovative products that have disrupted their industries for the better?arrow_forward
- What are the economic tradeoffs between low-income and high-income countries in international conferences on global environmental damage?arrow_forwardKraft and Cadbury When Kraft recently bid 16.7 billion for Cadbury, Cadburys market value rose, but Krafts market value fell by more. What does this tell you about the value-creating potential of the deal?arrow_forwardTable 33.15 shows how the average costs of production for semiconductors (the chips In computer memories) change as the quantity of semiconductors built at that factory increases. Based on these data, sketch a curve with quantity produced on the horizontal axis and average cost of production on the vertical axis. How does the curve illustrate economies of scale? If the equilibrium quantity of semiconductors demanded is 90,000, can this economy take full advantage of economies of scale? What about if quantity demanded is 70,000 semiconductors? 50,000 semiconductors? 30,000 semiconductors? Explain how international trade could make it possible for even a small economy to take full advantage of economies of scale, while also benefiting from competition and the variety offered by several producers.arrow_forward
- Becky and Sarah are sisters 1who share a room. Their room can easily get messy, and their parents am always telling them to tidy it. Here are the costs and benefits to both Becky and Sarah, of taking the time to clean their room: If both Becky and Sarah clean, they each spends two hours and get a clean room. If Becky decides not to clean and Sarah does all the cleaning, then Sarah spends 10 hours cleaning (Becky spends 0) but Sarah is exhausted. The same would occur for Becky if Sarah decided not to clean—Becky spends 10 hours and becomes exhausted. If both girls decide not to clean, they both have a dirty room. What is the best outcome for Becky and Sarah? What is the worst outcome? (It would help you to construct a prisoners dilemma table.) Unfortunately, we know that the optimal outcome will most liker not happen, and that the sisters probably will choose the worst one instead. Explain what it is about Beckys and Sarahs reasoning that will lead them both to choose the worst outcome.arrow_forwardConsider two ways of protecting elephants from poachers in African countries. In one approach, the government sets up enormous national parks that have sufficient habitat for elephants to thrive and forbids all local people to enter the parks or to injure either the elephants or their habitat in any way. In a second approach, the government sets up national parks and designates 10 villages around the edges of the park as official tourist centers that become places where tourists can stay and bases for guided tours inside the national park. Consider the different incentives of local villagers-who often are very poor-in each of these plans. Which plan seems more likely to help the elephant population?arrow_forwardThink back to a purchase that you made recently. How would you describe your thinking before you made that purchase?arrow_forward
- What factors does Paul Krugman identity that supported expanding international trade in the 1800s?arrow_forwardIn the Southern Company Managerial Challenge, which alternative for complying with the Clean Air Act creates the greatest real option value? How exactly does that alternative save money? Why? Explain why installing a scrubber burns this option.arrow_forwardWhy has coal dominated as a fuel source for 24/7/365 electricity generation for so many decades?arrow_forward
arrow_back_ios
SEE MORE QUESTIONS
arrow_forward_ios
Recommended textbooks for you
 Principles of Economics 2eEconomicsISBN:9781947172364Author:Steven A. Greenlaw; David ShapiroPublisher:OpenStax
 Principles of Economics, 7th Edition (MindTap Cou...EconomicsISBN:9781285165875Author:N. Gregory MankiwPublisher:Cengage Learning
 Principles of MicroeconomicsEconomicsISBN:9781305156050Author:N. Gregory MankiwPublisher:Cengage Learning
 Microeconomics: Principles & PolicyEconomicsISBN:9781337794992Author:William J. Baumol, Alan S. Blinder, John L. SolowPublisher:Cengage Learning
 Microeconomics: Private and Public Choice (MindTa...EconomicsISBN:9781305506893Author:James D. Gwartney, Richard L. Stroup, Russell S. Sobel, David A. MacphersonPublisher:Cengage Learning
Principles of Economics 2e
Economics
ISBN:9781947172364
Author:Steven A. Greenlaw; David Shapiro
Publisher:OpenStax
Principles of Economics, 7th Edition (MindTap Cou...
Economics
ISBN:9781285165875
Author:N. Gregory Mankiw
Publisher:Cengage Learning
Principles of Microeconomics
Economics
ISBN:9781305156050
Author:N. Gregory Mankiw
Publisher:Cengage Learning
Microeconomics: Principles & Policy
Economics
ISBN:9781337794992
Author:William J. Baumol, Alan S. Blinder, John L. Solow
Publisher:Cengage Learning
Microeconomics: Private and Public Choice (MindTa...
Economics
ISBN:9781305506893
Author:James D. Gwartney, Richard L. Stroup, Russell S. Sobel, David A. Macpherson
Publisher:Cengage Learning