MATLAB: An Introduction with Applications
6th Edition
ISBN: 9781119256830
Author: Amos Gilat
Publisher: John Wiley & Sons Inc
expand_more
expand_more
format_list_bulleted
Question
thumb_up100%
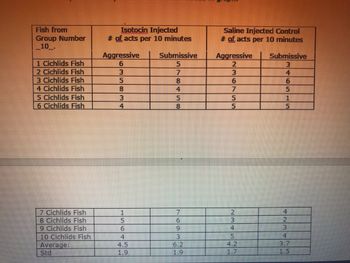
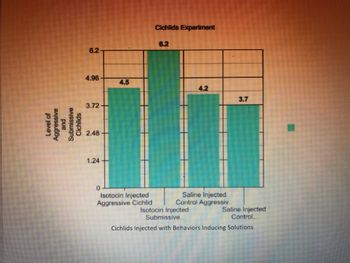
Fish produce a hormone called isotocin, a hormone that is similar to oxytocin in mammals. Both hormones, oxytocin and isotocin, have been linked to social behaviors including the suppression of social anxiety, trust, and attachment. Prior to this study the relationship between isotocin in the bloodstream and the amount of aggression or submission individual cichlid fish display was unknown. The researchers hypothesized that isotocin would suppress aggressive behaviors in cichlids to promote social cohesion as these fish exist in large social groups (schools). To address this hypothesis each of 10 fish were exposed to two treatments 1 week apart. One at a time a fish was randomly selected from the group of 10 and either injected with a saline solution ( that served as the control) or with isotocin. After this injection the fish was returned to its group and the amount of aggressive and submissive behaviors the fish demonstrated was recorded for the next 10 minutes. One week later this process was repeated with each fish recieve f the treatment it did not experience the week prior. This each fish served as its own control.
4. Describe a follow up study that you could do to further address the relationship between the cichlid fish dominance and aggressive behavior and isotocin. What would you do differently? What would you keep the same? Why?
5. Describe how researchers could take an adaptive value approach to understanding cichlid fish aggression and submissive behaviors amongst a school of fish.

Transcribed Image Text:Fish from
Group Number
10.
1 Cichlids Fish
2 Cichlids Fish
3 Cichlids Fish
4 Cichlids Fish
5 Cichlids Fish
6 Cichlids Fish
7 Cichlids Fish
8 Cichlids Fish
9 Cichlids Fish
10 Cichlids Fish
Average:
Std
Isotocin Injected
# of acts per 10 minutes
Submissive
Aggressive
6
8
3
1
5
6
4
4.5
8
4
5
8
764
9
3
6.2
Saline Injected Control
# of acts per 10 minutes
Submissive
Aggressive
2
3
6
5
2
3
1.7
4
6
1
5
4
2
3
4
1.5

Transcribed Image Text:Level of
Aggressive
and
Submissive
Cichlids
6.2
4.96
3.72-
2.48
1.24
0
4.5
Isotocin Injected
Aggressive Cichlid
Cichlids Experiment
4.2
Saline Injected
Control Aggressiv..
Isotocin Injected
3.7
Saline Injected
Control..
Submissive..
Cichlids Injected with Behaviors Inducing Solutions
Expert Solution
This question has been solved!
Explore an expertly crafted, step-by-step solution for a thorough understanding of key concepts.
This is a popular solution
Trending nowThis is a popular solution!
Step by stepSolved in 5 steps

Knowledge Booster
Similar questions
- Based on a graph below which of the following statement describes the best types of associations between Factors A, C, and D and the Disease: (choose one best answer) Factor Factor C Disease Factor A O Factor A is sufficient but not necessary, while Factors C and D and neither sufficient not necessary. O Factors A, C and D are neither sufficient nor necessary. O Factor A is necessary but not sufficient, while Factors C and D are necessary but not sufficient. O Factor A is sufficient but not necessary, while Factors C and D are neither sufficient not necessary.arrow_forwardI am determining how effective a Drug is at reducing inflammation in individuals infected with a virus. the serum levels of antibody are measured as a measure of inflammation (less antibodies means less inflammation which decreases virus mortality) in 30 people given placebo, 30 people given 1 unit of the drug, and 30 people given 2 units of the drug. I would like to determine what levels of the drug are effective, and if there are sex-specific effects. What are the dependent and independent variables in this experiment? age _________ sex __________ antibody level _____________ treatment ___________arrow_forwardTim is interested in studying whether Cognitive Behavioural Therapy (CBT) is an effective treatment for Obsessive Compulsive Disorder (OCD). Six people who were diagnosed with OCD participated in Tim's study, where he recorded the number of times they washed their hands per day for one month. They were then given a three week intensive CBT program before their hand-washing was monitored for another month. The average number of times per day each participant washed their hands over the two months of observation are as follows: Participant Month 1 Month 2 1 11 6 2 8 5 3 14 17 4 10 10 5 22 11 6 15 10 Compute the appropriate statistic to determine whether the program was effective and use this information to fill in the blanks: Q1. revealed that the number of times per day participants washed their hands following the CBT program was Q2. compared to the number of times per day participants washed their hands before the…arrow_forward
- The following data show the pattern of results that was obtained in a study by Liguori and Robinson (2001) examining how different levels of alcohol and caffeine consumption influenced response time in a simulated driving test. The means show the average response time in milliseconds for different combinations of alcohol and caffeine. Remember larger reaction time means someone is slower to respond. For these data, indicate which are true/false There is an interaction, caffeine has a larger impact on reaction times (makes people respond faster) when participants haven’t had alcohol) A. True B. Falsearrow_forwardCaptivity can influence immunological responses in some mammals. Seeber et al. (2020) investigated various aspects of immunological responses in captive and free-ranging zebras. One aspect of the study involved samples of 12 free-ranging zebras from Namibia, 9 from Tanzania, and 38 captive zebras from various zoos in Europe. (All of these were non-lactating females.) One of the measured variables from blood samples was lysozyme concentration (μg/L). (Lysozyme is a biomarker of the immune response.) The researchers were interested in investigating possible differences in lysozyme concentration between zebras in the various locations. As part of the analysis, they carried out a one-way ANOVA on the lysozyme concentrations for the zebras from the 3 locations, and found the following output. Df Sum Sq Mean Sq F value Pr(>F) Location 2 50.65 25.33 42.24 6.54e-12Residuals 56 33.57 0.60 Suppose the assumptions of one-way ANOVA…arrow_forwardA pharmaceutical company is testing a new drug for a rare disease. In a clinical trial, 1000 patients with the disease were randomly assigned to receive either the new drug or a placebo. After one year, it was found that 60% of the patients who received the new drug experienced improvement, compared to only 40% of those who received the placebo. Is the difference in improvement rates statistically significant? Provide your rationale.arrow_forward
- If my hypothesis assumes that religious women are more satisfied with life than men, would gender be my dependent variable? Religion and satisfaction with life are both independent? Is that correct?arrow_forwardOmitting a variable from our model that has a causal effect on our dependent variable always leads to omitted variable bias. a. False b. Truearrow_forwardA deficiency of the trace element selenium in the diet can negatively impact growth, immunity, muscle and neuromuscular function, and fertility. The introduction of selenium supplements to dairy cows is justified when pastures have low selenium levels. Authors of a research paper supplied the following data on milk selenium concentration (mg/L) for a sample of cows given a selenium supplement (the treatment group) and a control sample given no supplement, both initially and after a 9-day period. Initial Measurement Treatment Control 11.4 9.1 9.6 8.7 10.1 9.7 8.5 10.8 10.2 10.9 10.6 10.6 11.9 10.1 9.9 12.3 10.7 8.8 10.2 10.4 10.3 10.9 11.4 10.4 9.3 11.6 10.6 10.9 10.9 8.3 After 9 Days Treatment Control 138.3 9.2 104 8.9 96.4 8.9 89 10.1 88 9.6 103.8 8.6 147.3 10.4 97.1 12.4 172.6 9.2 146.3 9.5 99 8.4 122.3 8.8 103 12.5 117.8 9.1 121.5 93 (a) Use the given data for the treatment group to determine if…arrow_forward
- Most supermarkets use scanners at the checkout counters. The data collected this way can be used to evaluate the effect of price and store's promotional activities on the sales of any product. The promotions at a store change weekly, and are mainly of two types: flyers distributed outside the store and through newspapers (which may or may not include that particular product), and in-store displays at the end of an aisle that call the customers' attention to the product. Weekly data was collected on a particular beverage brand, including sales (in number of units), price (in dollars), flyer (1 if product appeared that week, 0 if it didn't) and display (1 if a special display of the product was used that week, 0 if it wasn't).As a preliminary analysis, a simple linear regression model was done. The fitted regression equation was: sales = 2259 - 1418 price. The ANOVA F test p-value was .000, and r squared = 59.7%.According to this model, how many units will be sold, on average, when the…arrow_forwardRead the journal excerpt below:Exposure to light at night suppresses the physiologic production of melatonin, a hormone that has antiproliferative effects on intestinal cancers. Although observational studies have associated night-shift work with an increased risk of breast cancer, the effect of night-shift work on the risk of other cancers is not known. We examined the relationship between working rotating night shifts and the risk of colorectal cancers among female participants in the Nurses’ Health Study. We documented 602 incident cases of colorectal cancer among 78 586 women who were followed up from 1988 through 1998. Compared with women who never worked rotating night shifts, women who worked 15 years or more on rotating night shifts were 1.35 times more likely to develop colorectal cancer (95% CI = 1.03 to 1.77), adjusting for confounders. These data suggest that working a rotating night shift at least three nights per month for 15 or more years may increase the risk of…arrow_forwardA hypothetical study looks at the effect of drinking alcohol on health. Across all genders and age groups, people who do not drink tend to be healthier on average than people who do drink. However, people who drink regularly are on average healthier than those people who have recently stopped drinking. Is it reasonable to conclude that for the sake of health, we should not start drinking, but if we have already started drinking alcohol, it is healthier to continue and not to stop?arrow_forward
arrow_back_ios
SEE MORE QUESTIONS
arrow_forward_ios
Recommended textbooks for you
 MATLAB: An Introduction with ApplicationsStatisticsISBN:9781119256830Author:Amos GilatPublisher:John Wiley & Sons Inc
 Probability and Statistics for Engineering and th...StatisticsISBN:9781305251809Author:Jay L. DevorePublisher:Cengage Learning
 Statistics for The Behavioral Sciences (MindTap C...StatisticsISBN:9781305504912Author:Frederick J Gravetter, Larry B. WallnauPublisher:Cengage Learning
 Elementary Statistics: Picturing the World (7th E...StatisticsISBN:9780134683416Author:Ron Larson, Betsy FarberPublisher:PEARSON
 The Basic Practice of StatisticsStatisticsISBN:9781319042578Author:David S. Moore, William I. Notz, Michael A. FlignerPublisher:W. H. Freeman
 Introduction to the Practice of StatisticsStatisticsISBN:9781319013387Author:David S. Moore, George P. McCabe, Bruce A. CraigPublisher:W. H. Freeman

MATLAB: An Introduction with Applications
Statistics
ISBN:9781119256830
Author:Amos Gilat
Publisher:John Wiley & Sons Inc

Probability and Statistics for Engineering and th...
Statistics
ISBN:9781305251809
Author:Jay L. Devore
Publisher:Cengage Learning

Statistics for The Behavioral Sciences (MindTap C...
Statistics
ISBN:9781305504912
Author:Frederick J Gravetter, Larry B. Wallnau
Publisher:Cengage Learning

Elementary Statistics: Picturing the World (7th E...
Statistics
ISBN:9780134683416
Author:Ron Larson, Betsy Farber
Publisher:PEARSON

The Basic Practice of Statistics
Statistics
ISBN:9781319042578
Author:David S. Moore, William I. Notz, Michael A. Fligner
Publisher:W. H. Freeman

Introduction to the Practice of Statistics
Statistics
ISBN:9781319013387
Author:David S. Moore, George P. McCabe, Bruce A. Craig
Publisher:W. H. Freeman