
MATLAB: An Introduction with Applications
6th Edition
ISBN: 9781119256830
Author: Amos Gilat
Publisher: John Wiley & Sons Inc
expand_more
expand_more
format_list_bulleted
Related questions
Concept explainers
Topic Video
Question
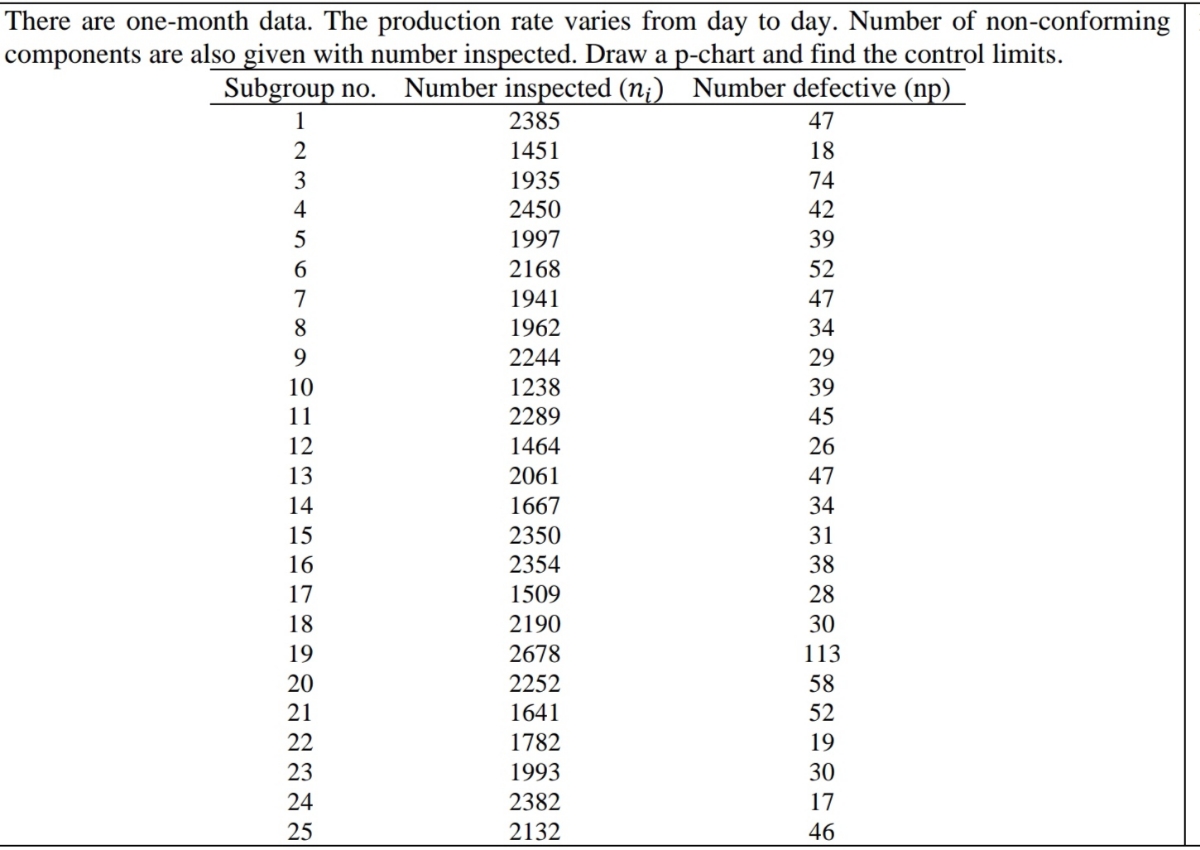
There are one-month data. The production rate varies from day to day. Number of non-conforming
components are also given with number inspected. Draw a p-chart and find the control limits.

Transcribed Image Text:There are one-month data. The production rate varies from day to day. Number of non-conforming
components are also given with number inspected. Draw a p-chart and find the control limits.
Subgroup no.
Number inspected (n;) Number defective (np)
1
2385
47
2
1451
18
3
1935
74
4
2450
42
1997
39
2168
52
7
1941
47
8.
1962
34
9.
2244
29
10
1238
39
11
2289
45
12
1464
26
13
2061
47
14
1667
34
15
2350
31
16
2354
38
17
1509
28
18
2190
30
19
2678
113
20
2252
58
21
1641
52
22
1782
19
23
1993
30
24
2382
17
25
2132
46
Expert Solution
This question has been solved!
Explore an expertly crafted, step-by-step solution for a thorough understanding of key concepts.

Step by stepSolved in 4 steps with 1 images

Knowledge Booster


Learn more about
Need a deep-dive on the concept behind this application? Look no further. Learn more about this topic, statistics and related others by exploring similar questions and additional content below.Similar questions
- 5.Identify the following as being discrete or continuous data. Explain.a. The average number of pets was 1.823b. The puppy weighed 2 poundsarrow_forwardEyeglassomatic manufactures eyeglasses for different retailers. They test to see how many defective lenses they made the time period of January 1 to March 31. The table gives the defect and the number of defects. Do the data support the notion that each defect type occurs in the same proportion? Test at the 5% level. Number of Defective Lenses Defect type Number of defects Scratch 1866 Right shaped - small 1935 Flaked 1979 Wrong axis 1921 Chamfer wrong 1864 Crazing, cracks 1991 Wrong shape 2004 Wrong PD 1895 Spots and bubbles 1917 Wrong height 1885 Right shape - big 1875 Lost in lab 1886 Spots/bubble - intern 1935 State the hypotheses.H0: Each defect type in the same proportion.Ha: Each defect type in the same proportion. Calculate the χ2 test statistic. Round expected values to two decimal places. Round χ2 to three decimal places.χ2 = Calculate the p-value. Round to four decimal places.p-value = State your decision.Since p-value 0.05,…arrow_forwardFor the following line graph, State at least one type of conclusion that could be made from the data provided for the KPI. Suggest one other data source that would provide more information to make data-driven decisions. Explain what information that source would supply. (I used the clustered bar chart) Examples: 1) The completion KPI measures the percentage of South Texas College students who finished their degree or certificate program within six years. From the line graph, it can be seen that the completion rates have remained nearly constant through the years. Data from the THECB was used in this case. 2) Information about the percentage of students who receive credit for attempted courses is available on the South Texas College KPI webpage. According to the data, over the past five years, an increasing number of students have been receiving credit for courses they have attempted. Data on the percentage of students who complete courses, the percentage of students who withdraw…arrow_forward
- Exercise 2. Use the final project data to complete the following questions. Collaborate with your project partners and produce the Excel outputs for the first analysis listed on the project guidelines below. Read and follow the instructions carefully. The Excel outputs such as tables, graphs, summary statistics produced by using Excel. All statistics should not have more than 2 decimal places. All Excel outputs (such as graphs and summary statistics) for each related analysis must be fitted in one sheet. 2. To analyze the total number of items purchased, construct an ungrouped frequency distribution, graph, and find the summary statistics by each type of customer (regular/promotion). Label the graphs completely. Describe the shape of the distribution for each type of customer and discuss similarities or differences by interpreting the graphs and summary statistics. What can you conclude? 3. To analyze customer age, construct a frequency distribution, graph, and find…arrow_forwardCalculate 90th percentile for Z.arrow_forward1. Determine whether the following variable is discrete or continuous: Room temperature (measured in Celsius) 2. A data set has mean=202, median=205 and mode=197. Determine the shape of the data. a. Skewed Left b. Symmetric c. Skewed Right d. Some other shapearrow_forward
- Determine which of the four levels of measurement ( norminal, ordinal, interval, ratio) is most appropriate for the data below. Years in which U.S. presidents were inauguratedarrow_forwardDefine effect size in your own words pleasearrow_forwardDefine the concepts of percentile and interquartile range.arrow_forward
arrow_back_ios
arrow_forward_ios
Recommended textbooks for you
- MATLAB: An Introduction with ApplicationsStatisticsISBN:9781119256830Author:Amos GilatPublisher:John Wiley & Sons Inc
 Probability and Statistics for Engineering and th...StatisticsISBN:9781305251809Author:Jay L. DevorePublisher:Cengage Learning
 Statistics for The Behavioral Sciences (MindTap C...StatisticsISBN:9781305504912Author:Frederick J Gravetter, Larry B. WallnauPublisher:Cengage Learning
  Elementary Statistics: Picturing the World (7th E...StatisticsISBN:9780134683416Author:Ron Larson, Betsy FarberPublisher:PEARSON
 The Basic Practice of StatisticsStatisticsISBN:9781319042578Author:David S. Moore, William I. Notz, Michael A. FlignerPublisher:W. H. Freeman
 Introduction to the Practice of StatisticsStatisticsISBN:9781319013387Author:David S. Moore, George P. McCabe, Bruce A. CraigPublisher:W. H. Freeman
MATLAB: An Introduction with Applications
Statistics
ISBN:9781119256830
Author:Amos Gilat
Publisher:John Wiley & Sons Inc
Probability and Statistics for Engineering and th...
Statistics
ISBN:9781305251809
Author:Jay L. Devore
Publisher:Cengage Learning
Statistics for The Behavioral Sciences (MindTap C...
Statistics
ISBN:9781305504912
Author:Frederick J Gravetter, Larry B. Wallnau
Publisher:Cengage Learning
Elementary Statistics: Picturing the World (7th E...
Statistics
ISBN:9780134683416
Author:Ron Larson, Betsy Farber
Publisher:PEARSON
The Basic Practice of Statistics
Statistics
ISBN:9781319042578
Author:David S. Moore, William I. Notz, Michael A. Fligner
Publisher:W. H. Freeman
Introduction to the Practice of Statistics
Statistics
ISBN:9781319013387
Author:David S. Moore, George P. McCabe, Bruce A. Craig
Publisher:W. H. Freeman