MATLAB: An Introduction with Applications
6th Edition
ISBN: 9781119256830
Author: Amos Gilat
Publisher: John Wiley & Sons Inc
expand_more
expand_more
format_list_bulleted
Question
thumb_up100%

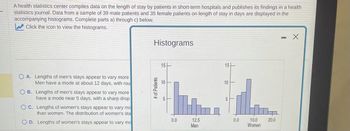
Transcribed Image Text:A health statistics center compiles data on the length of stay by patients in short-term hospitals and publishes its findings in a health
statistics journal. Data from a sample of 39 male patients and 35 female patients on length of stay in days are displayed in the
accompanying histograms. Complete parts a) through c) below.
Click the icon to view the histograms.
OA. Lengths of men's stays appear to vary more
Men have a mode at about 12 days, with rou
OB. Lengths of men's stays appear to vary more
have a mode near 5 days, with a sharp drop
OC. Lengths of women's stays appear to vary mo
than women. The distribution of women's sta
D. Lengths of women's stays appear to vary mo
Histograms
# of Patients
15-
0.0
12.5
Men
15
10
5
0.0
10.0
Women
20.0
X

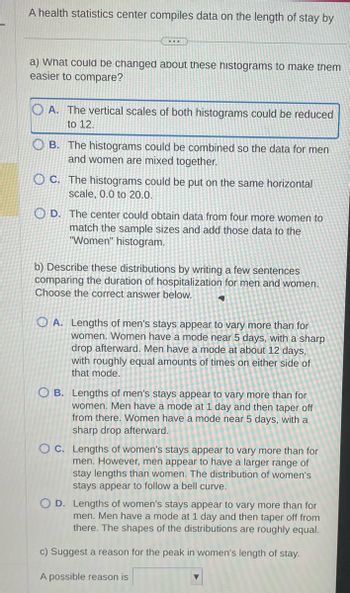
Transcribed Image Text:A health statistics center compiles data on the length of stay by
...
a) what could be changed about these histograms to make them
easier to compare?
A. The vertical scales of both histograms could be reduced
to 12.
OB. The histograms could be combined so the data for men
and women are mixed together.
OC. The histograms could be put on the same horizontal
scale, 0.0 to 20.0.
D. The center could obtain data from four more women to
match the sample sizes and add those data to the
"Women" histogram.
b) Describe these distributions by writing a few sentences
comparing the duration of hospitalization for men and women.
Choose the correct answer below.
4
OA. Lengths of men's stays appear to vary more than for
women. Women have a mode near 5 days, with a sharp
drop afterward. Men have a mode at about 12 days,
with roughly equal amounts of times on either side of
that mode.
OB. Lengths of men's stays appear to vary more than for
women. Men have a mode at 1 day and then taper off
from there. Women have a mode near 5 days, with a
sharp drop afterward.
OC. Lengths of women's stays appear to vary more than for
men. However, men appear to have a larger range of
stay lengths than women. The distribution of women's
stays appear to follow a bell curve.
OD. Lengths of women's stays appear to vary more than for
men. Men have a mode at 1 day and then taper off from
there. The shapes of the distributions are roughly equal.
c) Suggest a reason for the peak in women's length of stay.
A possible reason is
Expert Solution
This question has been solved!
Explore an expertly crafted, step-by-step solution for a thorough understanding of key concepts.
This is a popular solution
Trending nowThis is a popular solution!
Step by stepSolved in 4 steps

Knowledge Booster
Similar questions
- Assume that the histograms are drawn on the same scale. Which of the histograms has the smallest interquartile range (IQR)? I II III IV Histogram I O Histogram II O Histogram III O Histogram IVarrow_forwardMost people think London, England is one of the rainiest cities in the world. However, it receives less rain than both Brussels and Zurich, which are two other cities in Europe. The amount of average rainfall in each of the cities is found in the data table below. Average Rainfall (mm) Jan Feb MarAprMayJun Jul AugSepOctNov DecTotal Brussels71 53 73 54 70 78 69 64 63 68 79 79 820 London 42 36 40 40 45 47 35 54 51 61 58 48 558 Zurich 67 70 69 87 103 12411713392 69 82 73 1086 How much rainfall difference is there in an average year between London and Zurich? Record your answer and fill in the bubbles on your answer document. Be sure to use the correct place value.arrow_forwardA toolset from the Uniform Crime Reporting (UCR) Program by the FBI allows the public to view summarized crime data at a state level. The user accessing the website can select between viewing the violent crime rate or the property crime rate. Choose the best description of the type of data collected in this selection. A. Ranked categorical B. Binary categorical C. Discrete quantitative D. Continuous quantitativearrow_forward
- Nonearrow_forwardThe particular method of analysis in a research study depends on: A. Research questionB. Study designC. Level of measurementD. All of the aboveE. A and B onlyarrow_forwardFourteen different second-year medical students at a hospital measured the blood pressure of the same person. The systolic readings (mm Hg) are listed below. Use the given data to construct a boxplot and identify the 5-number summary.arrow_forward
- In order to determine if there was a relationship between living near power lines and a rare disease, what type of study design could be used? Edit View Insert Format Tools Tablearrow_forward...arrow_forwardUse the provided histogram to answer questions about the number of births for each age group. 1. How many births occurs among women over the age of 40? 2. What percentage of births occurred among women between the ages of 38 and 40?arrow_forward
- Consider these data: 5.52, 5.96, 5.87, 6.04, 6.01, 5.79, 5.84, 5.59, 5.99, 5.66, 5.81, 5.46, 5.92, 5.80, 5.95 Which box plot best represents these data? 5.4 5.5 5.6 5.7 5.8 5.9 6 6.1 6.2 © 2020 Strong Mind. Created using GeoGebra. 5.4 5.5 5.6 5.7 5.8 5.9 6 6.1 6.2 © 2020 StrongMind. Created using GeoGebra. 5.4 5.5 5.6 5.7 5.8 5.9 6 6.1 6.2 2020 StrongMind. Created using GeoGebra. 5.4 5.5 5.6 5.7 5.8 5.9 6 6.1 6.2 © 2020 StrongMind. Created using GeoGebra.arrow_forwardFind the four averages using the data for “Race Time” on the force.arrow_forwardIndicate the level of measurement for the data set described. Weights of newborn babies a. interval b. ratio c. nominal d. ordinalarrow_forward
arrow_back_ios
SEE MORE QUESTIONS
arrow_forward_ios
Recommended textbooks for you
 MATLAB: An Introduction with ApplicationsStatisticsISBN:9781119256830Author:Amos GilatPublisher:John Wiley & Sons Inc
 Probability and Statistics for Engineering and th...StatisticsISBN:9781305251809Author:Jay L. DevorePublisher:Cengage Learning
 Statistics for The Behavioral Sciences (MindTap C...StatisticsISBN:9781305504912Author:Frederick J Gravetter, Larry B. WallnauPublisher:Cengage Learning
 Elementary Statistics: Picturing the World (7th E...StatisticsISBN:9780134683416Author:Ron Larson, Betsy FarberPublisher:PEARSON
 The Basic Practice of StatisticsStatisticsISBN:9781319042578Author:David S. Moore, William I. Notz, Michael A. FlignerPublisher:W. H. Freeman
 Introduction to the Practice of StatisticsStatisticsISBN:9781319013387Author:David S. Moore, George P. McCabe, Bruce A. CraigPublisher:W. H. Freeman

MATLAB: An Introduction with Applications
Statistics
ISBN:9781119256830
Author:Amos Gilat
Publisher:John Wiley & Sons Inc

Probability and Statistics for Engineering and th...
Statistics
ISBN:9781305251809
Author:Jay L. Devore
Publisher:Cengage Learning

Statistics for The Behavioral Sciences (MindTap C...
Statistics
ISBN:9781305504912
Author:Frederick J Gravetter, Larry B. Wallnau
Publisher:Cengage Learning

Elementary Statistics: Picturing the World (7th E...
Statistics
ISBN:9780134683416
Author:Ron Larson, Betsy Farber
Publisher:PEARSON

The Basic Practice of Statistics
Statistics
ISBN:9781319042578
Author:David S. Moore, William I. Notz, Michael A. Fligner
Publisher:W. H. Freeman

Introduction to the Practice of Statistics
Statistics
ISBN:9781319013387
Author:David S. Moore, George P. McCabe, Bruce A. Craig
Publisher:W. H. Freeman