Human Anatomy & Physiology (11th Edition)
11th Edition
ISBN: 9780134580999
Author: Elaine N. Marieb, Katja N. Hoehn
Publisher: PEARSON
expand_more
expand_more
format_list_bulleted
Question
I am needing help with 1 through 3, please
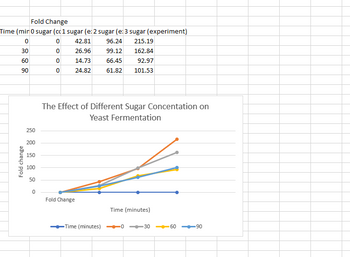
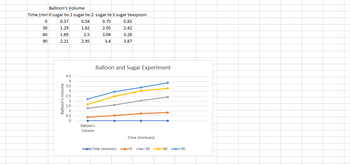
1) Using the graphs, indicate if the data supports or does not support the hypothesis: The rate of balloon inflation will be directly proportional to the amount of sugar added to the yeast solution. Also, which graph illustrates the most clearly what happened in the experiment and why?
2) Which graph illustrates the most clearly what happened in the experiment? Why?
3) Glycolysis in an anaerobic environment produces a net of 2 ATP and Pyruvate. Why does Yeast bother to ferment Pyruvate to Ethanol?

Transcribed Image Text:Fold Change
Time (min 0 sugar (cc1 sugar (e: 2 sugar (e: 3 sugar (experiment)
0
0
96.24
215.19
0
99.12
162.84
0
66.45
92.97
0
61.82 101.53
30
60
90
Fold change
250
200
150
100
50
0
42.81
26.96
14.73
24.82
The Effect of Different Sugar Concentation on
Yeast Fermentation
Fold Change
Time (minutes)
Time (minutes)
0
30
60
90

Transcribed Image Text:Balloon's Volume
Time (min 0 sugar te: 1 sugar te: 2 sugar te 3 sugar teaspoon
0.37
0.54
0.75
1.29
1.62
2.05
1.69
2.5
3.04
2.21
2.95
3.4
0
30
60
90
4.5
4
3.5
3
volume
Nw
2.5
2
1.5
1
0.5
0
Balloon's
Volume
0.83
2.42
3.28
3.87
Balloon and Sugar Experiment
Time (mintues)
→→→Time (minutes) --0-30-60-90
Expert Solution
This question has been solved!
Explore an expertly crafted, step-by-step solution for a thorough understanding of key concepts.
This is a popular solution
Trending nowThis is a popular solution!
Step by stepSolved in 4 steps with 2 images

Knowledge Booster
Learn more about
Need a deep-dive on the concept behind this application? Look no further. Learn more about this topic, biology and related others by exploring similar questions and additional content below.Similar questions
- Please answer the questions and their parts. Thank you so much!arrow_forwardIm having trouble with the parts 1 and 3arrow_forwardThe purpose of the progress curve is to determine if an enzymatic reaction rate remains constant for given concentrations of enzyme and substrate, for a given assay time (20 min). How long did the rate of reaction of WGAP remain constant in your experiments? How do you know? What would cause the reaction rate to not be constant and plateau after some time?arrow_forward
- } Problem #1: Batch Fermentation Assuming the batch fermentation is conducted under the following conditions: Mm maximum specific growth rate = 1.0/hr KM Monod constant = 20 g/l Yx/s = yield coefficient for cell mass/substrate consumed = 0.4 g/g initial cell mass concentrate = 0.1 g/l Xo So initial substrate concentration = 20 g/l Yxo yield coefficient for cell mass/mass oxygen consumed = 1.0 g/g Po initial product concentration = 0 g/g BYP/x-yield coefficient for product/cell mass, (for product is growth associated) = 0.2 g/g/hr www. - wwwww = www. Ttotal total hours for the fermentation cycle = 20 hr. wwww Plot the fermentation history curves (i.e. X, S, P and Oxygen Uptake Rate (OUR), v.S. time)arrow_forwardMultiple answers are accepted for this questionarrow_forwardI need help with a biology question on enzyme denaturation, I need help with questions, one and two, which is regarding the graph I made, please let me know if you have any questions, thanks Graph your observed results from Table 2. Include labeled axes, a descriptive title, and a colored key tothe data lines. Do not graph zero values.Further questions:-1. Looking at your graph, what trends occurred inTreatment 1,Treatment 2Treatment 3Treatment 4.Treatment 5Treatment 6 2. carbon dioxide was produced in treatment 6, what does that suggest about the experiment?arrow_forward
- Please don't provide handwriting solutionarrow_forwardPlease help me with finding the hypotheses that are being testing in each of the three enzyme experiments(the three tables below), and predicting the results of each of the three experiments based on the hypotheses (if/then). The laboratory experiment is enzyme activity.arrow_forwardQuestion 3 List three species of bacteria (using complete genus and species names, correct binomial nomenclature, and correct spelling) that can be differentiated using the Enteropleuri test (Enterotube) system.arrow_forward
arrow_back_ios
SEE MORE QUESTIONS
arrow_forward_ios
Recommended textbooks for you
 Human Anatomy & Physiology (11th Edition)BiologyISBN:9780134580999Author:Elaine N. Marieb, Katja N. HoehnPublisher:PEARSON
 Biology 2eBiologyISBN:9781947172517Author:Matthew Douglas, Jung Choi, Mary Ann ClarkPublisher:OpenStax
 Anatomy & PhysiologyBiologyISBN:9781259398629Author:McKinley, Michael P., O'loughlin, Valerie Dean, Bidle, Theresa StouterPublisher:Mcgraw Hill Education,
 Molecular Biology of the Cell (Sixth Edition)BiologyISBN:9780815344322Author:Bruce Alberts, Alexander D. Johnson, Julian Lewis, David Morgan, Martin Raff, Keith Roberts, Peter WalterPublisher:W. W. Norton & Company
 Laboratory Manual For Human Anatomy & PhysiologyBiologyISBN:9781260159363Author:Martin, Terry R., Prentice-craver, CynthiaPublisher:McGraw-Hill Publishing Co.
 Inquiry Into Life (16th Edition)BiologyISBN:9781260231700Author:Sylvia S. Mader, Michael WindelspechtPublisher:McGraw Hill Education

Human Anatomy & Physiology (11th Edition)
Biology
ISBN:9780134580999
Author:Elaine N. Marieb, Katja N. Hoehn
Publisher:PEARSON

Biology 2e
Biology
ISBN:9781947172517
Author:Matthew Douglas, Jung Choi, Mary Ann Clark
Publisher:OpenStax

Anatomy & Physiology
Biology
ISBN:9781259398629
Author:McKinley, Michael P., O'loughlin, Valerie Dean, Bidle, Theresa Stouter
Publisher:Mcgraw Hill Education,

Molecular Biology of the Cell (Sixth Edition)
Biology
ISBN:9780815344322
Author:Bruce Alberts, Alexander D. Johnson, Julian Lewis, David Morgan, Martin Raff, Keith Roberts, Peter Walter
Publisher:W. W. Norton & Company

Laboratory Manual For Human Anatomy & Physiology
Biology
ISBN:9781260159363
Author:Martin, Terry R., Prentice-craver, Cynthia
Publisher:McGraw-Hill Publishing Co.

Inquiry Into Life (16th Edition)
Biology
ISBN:9781260231700
Author:Sylvia S. Mader, Michael Windelspecht
Publisher:McGraw Hill Education