
Practical Management Science
6th Edition
ISBN: 9781337406659
Author: WINSTON, Wayne L.
Publisher: Cengage,
expand_more
expand_more
format_list_bulleted
Related questions
Question
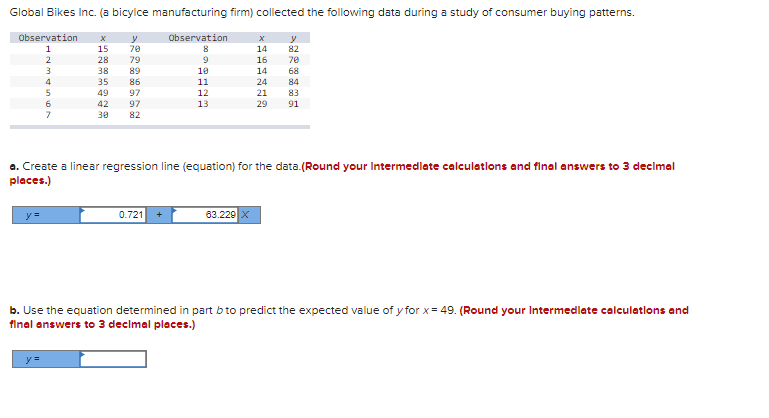

Transcribed Image Text:Global Bikes Inc. (a bicylce manufacturing firm) collected the following data during a study of consumer buying patterns.
Observation
1
2
3
4
5
6
7
y=
X
y
15
70
28
79
38
89
35
86
49 97
42
97
30 82
y =
Observation
0.721 +
1890123
a. Create a linear regression line (equation) for the data.(Round your Intermediate calculations and final answers to 3 decimal
places.)
X
14
16
14
24
21
29
63.229 X
y
82
70
68
84
83
91
b. Use the equation determined in part b to predict the expected value of y for x = 49. (Round your Intermediate calculations and
final answers to 3 decimal places.)
Expert Solution
This question has been solved!
Explore an expertly crafted, step-by-step solution for a thorough understanding of key concepts.

This is a popular solution

Trending nowThis is a popular solution!

Step by stepSolved in 4 steps with 4 images

Knowledge Booster

Similar questions
- Pls answer b and carrow_forwardHere are the data for the past 21 months for actual sales of a particular product: LAST YEAR THIS YEAR January 315 February 418 March 390 April 430 May 400 [ June 480 July 430 August 320 September 385 October 530 November 592 555 December 300 400 350 460 390 395 355 245 340 Develop a forecast for the fourth quarter using a three-quarter, weighted moving average. Weight the most recent quarter 0.50, the second most recent 0.25, and the third 0.25. Do the problem using quarters, as opposed to forecasting separate months. (Round your answer to 2 decimal places.) Forecast for the fourth quarterarrow_forwardsniparrow_forward
- Tucson Machinery, Inc., manufactures numerically controlled machines, which sell for an average price of $14.0 million each. Sales for these NCMs for the past two years were as follows: Use Exhibit 3.10. QUARTER LAST YEAR I II III IV QUANTITY (UNITS) Y = 14 20 28 18 QUARTER THIS YEAR I II III IV QUANTITY (UNITS) 20 26 30 15 a. Find the equation of a simple linear regression line using Excel. (Round your answers to 3 decimal places.) > Answer is complete but not entirely correct. 18.535 X + 0.630 tarrow_forwardPlease help with correct answers: step by step: last time submitted- answers were incorrect A statistical program is recommended. The quarterly sales data (number of copies sold) for a college textbook over the past three years follow. Quarter Year 1 Year 2 Year 3 1 1,690 1,800 1,850 2 940 900 1,100 3 2,625 2,900 2,930 4 2,500 2,360 2,615 a) Use a regression model with dummy variables as follows to develop an equation to account for seasonal effects in the data. (Round your numerical values to the nearest integer.) Qrt1 = 1 if quarter 1, 0 otherwise; Qrt2 = 1 if quarter 2, 0 otherwise; Qrt3 = 1 if quarter 3, 0 otherwise t = b) Using the equation developed in part (b), compute the quarterly forecasts for year 4. (Round your answers to the nearest ten.) quarter 1 forecast____? quarter 2 forecast____? quarter 3 forecast ____? quarter 4 forecast ____? c) Let t = 1 refer to the observation in Quarter 1 of Year 1; let t = 2 refer to the observation in Quarter 2 of Year…arrow_forwardConsider the following time series data. Quarter Year 1 Year 2 Year 3 1 4 6 7 2 2 3 6 3 3 5 6 4 5 7 8 a. Construct a time series plot. What type of pattern exists in the data? Trend Pattern Seasonal Pattern Horizontal Pattern O Trend and Seasonal Pattern Question 11 5 pts b. Create the following dummy variables: Qtr1 = 1 if quarter 1, 0 otherwise; Qtr2 = 1 if quarter 2, 0 otherwise; Qtr3 = 1 if quarter 3, 0 otherwise. Create a variable t such that t = 1 for quarter 1 of year 1, t = 2 for quarter 2 of year 1, ..., t = 12 for quarter 4 of year 3. Use these dummy variables and t to develop an estimated regression equation to account for seasonal effects and any linear trend in the data. What is the forecast for quarter 1 of next year?arrow_forward
- data table below shows the number of computers sold at the Best Buy Store in a week, based on online ads. Online Ad Computers Sold 2 25 1 10 4 30 1 10 2 25 sigma)x=10 sigma)y=100 draw the graph of the regression equation, showing the slope and y intercepts?arrow_forwardWhat is 'forecasting error'? What are the metrics used in measuring forecasting errors?arrow_forwardPlease answer this simple questionarrow_forward
- Hi, I need help with solving for the following values (boxed). Thank you.arrow_forwardThe following gives the number of accidents that occurred on Florida State Highway 101 during the last 4 months: Jan Feb Mar AprMonth 1 2 3 4Number of Accidents 25 40 60 105 Using the least-squares regression method, the trend equation for forecasting is (round your responses to two decimal places): y = ? + ?xarrow_forwardUse a graphing calculator to create a scatter plot and find the line of best fit and the correlation coefficient for the following data. Round to the nearest hundredth. X 5 10 15 20 25 30 35 y 1,800 1,750 1,590 1,490 1,400 1,275 1,010arrow_forward
arrow_back_ios
SEE MORE QUESTIONS
arrow_forward_ios
Recommended textbooks for you
- Practical Management ScienceOperations ManagementISBN:9781337406659Author:WINSTON, Wayne L.Publisher:Cengage,
 Operations ManagementOperations ManagementISBN:9781259667473Author:William J StevensonPublisher:McGraw-Hill Education
 Operations and Supply Chain Management (Mcgraw-hi...Operations ManagementISBN:9781259666100Author:F. Robert Jacobs, Richard B ChasePublisher:McGraw-Hill Education
 Purchasing and Supply Chain ManagementOperations ManagementISBN:9781285869681Author:Robert M. Monczka, Robert B. Handfield, Larry C. Giunipero, James L. PattersonPublisher:Cengage Learning
 Production and Operations Analysis, Seventh Editi...Operations ManagementISBN:9781478623069Author:Steven Nahmias, Tava Lennon OlsenPublisher:Waveland Press, Inc.
Practical Management Science
Operations Management
ISBN:9781337406659
Author:WINSTON, Wayne L.
Publisher:Cengage,
Operations Management
Operations Management
ISBN:9781259667473
Author:William J Stevenson
Publisher:McGraw-Hill Education
Operations and Supply Chain Management (Mcgraw-hi...
Operations Management
ISBN:9781259666100
Author:F. Robert Jacobs, Richard B Chase
Publisher:McGraw-Hill Education
Purchasing and Supply Chain Management
Operations Management
ISBN:9781285869681
Author:Robert M. Monczka, Robert B. Handfield, Larry C. Giunipero, James L. Patterson
Publisher:Cengage Learning
Production and Operations Analysis, Seventh Editi...
Operations Management
ISBN:9781478623069
Author:Steven Nahmias, Tava Lennon Olsen
Publisher:Waveland Press, Inc.