
Practical Management Science
6th Edition
ISBN: 9781337406659
Author: WINSTON, Wayne L.
Publisher: Cengage,
expand_more
expand_more
format_list_bulleted
Related questions
Question
4
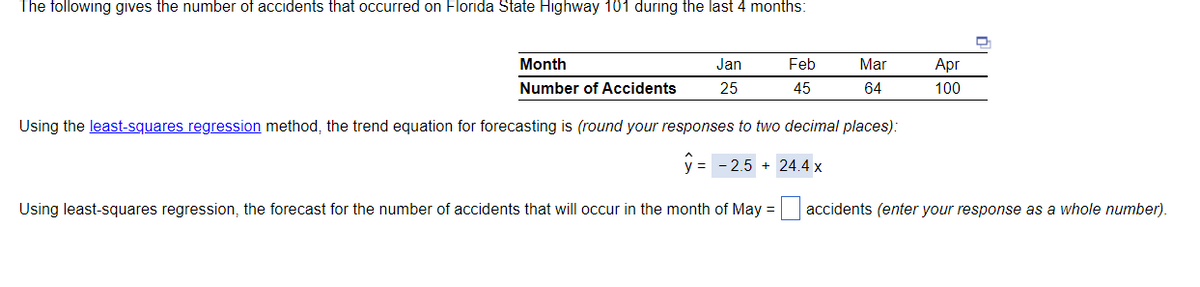

Transcribed Image Text:The following gives the number of accidents that occurred on Florida State Highway 101 during the last 4 months:
Month
Number of Accidents
Using the least-squares regression method, the trend equation for forecasting is (round your responses to two decimal places):
y = -2.5 24.4 x
Jan
25
Using least-squares regression, the forecast for the number of accidents that will occur in the month of May =
Feb
45
Mar
64
Apr
100
accidents (enter your response as a whole number).
Expert Solution
This question has been solved!
Explore an expertly crafted, step-by-step solution for a thorough understanding of key concepts.

Step by stepSolved in 5 steps with 8 images

Knowledge Booster

Similar questions
- Ch. 8 Q1arrow_forward16. Why do firms use event sponsorship?.arrow_forwardComplete the Case Problem (Ch. 15) As the newly named president and CEO of Tourism Banff, the Destination Management Organization for the world-famous iconic tourism community location in Banff National Park (BNP), and Canada’s first and most famous national park, you have been asked to formulate a tourism development and promotion policy which balances the needs of residents of the small community of 6,700 permanent residents and the over 5 million annual visitors to BNP. In formulating the requested policy, keep in mind that the town of Banff is located in a National Park, how would you balance the rights and responsibilities of: ENDNOTES a. permanent residents of the community; b. visitors living in the nearby city of Calgary; and c. visitors from the rest of Canada? How would you decide which kind of tourism activities you would both allow and encourage within the National Park?arrow_forward
- Pls help ASAParrow_forward470 q 16 a speculative stock possessees a _________ probability of _________ return and is currently _______- a. high, negative, underpriced b. high, negative, overpriced c. high, positive, overpriced d. low, negative, overpriced e. low, positive, underpricedarrow_forwardEx 4.12 Formulate the linear programming model of the following problems. Titan Credit Card Marketing works for HSBC to verify and approve credit card application. TCCM receives P380 for every completed customer application. The company maintained three call agents targeting at P20,000 worth of approvals daily, altogether. In a regular working day, James can process as much as P3000 worth of applications. Mark can process twice as much as Tim. How many credit cards should each call agent process to achieve the target for the day. Formulate the LP modelarrow_forward
- Q.14. What do you mean by organising function? Explain the common type of organisational structures adopted by the companies these days? (10)arrow_forward15 If two variables were perfectly correlated, what would the coefficient of correlation r equal? Select one: a. -1 b. 0 c. none of the above d. -1 or 1 e. 1arrow_forwardA.3 Yellowburn University, a not-for-profit higher education organization, has the following mission statement: ‘We aim to deliver excellent tuition in state-of-the-art facilities to help develop socially responsible students and to contribute to global academic research.’ Which TWO of the following would be appropriate objectives to fit in with this mission? To deliver the best possible lessons. Each member of staff is to write two research papers for publication over the next two years. To increase car parking space at the university by 10% in the next 12 months to improve access. To get 15% of all students to receive first class honors degrees each year. To ensure 100% attendance from all students for every lecture.arrow_forward
- am. 105.arrow_forwardQ.10. The following are all advantages of business partnerships EXCEPT: Partnerships shield the individual partners from debt and liability Partnerships are relatively easy and inexpensive to set up Partnerships pool the resources of the partners to obtain capital 4. Partnerships can take advantage of the various skills, strengths, and experiences of each of the partners. Select one and explain?arrow_forwardf1. Subject :- Accountingarrow_forward
arrow_back_ios
SEE MORE QUESTIONS
arrow_forward_ios
Recommended textbooks for you
- Practical Management ScienceOperations ManagementISBN:9781337406659Author:WINSTON, Wayne L.Publisher:Cengage,
 Operations ManagementOperations ManagementISBN:9781259667473Author:William J StevensonPublisher:McGraw-Hill Education
 Operations and Supply Chain Management (Mcgraw-hi...Operations ManagementISBN:9781259666100Author:F. Robert Jacobs, Richard B ChasePublisher:McGraw-Hill Education
 Purchasing and Supply Chain ManagementOperations ManagementISBN:9781285869681Author:Robert M. Monczka, Robert B. Handfield, Larry C. Giunipero, James L. PattersonPublisher:Cengage Learning
 Production and Operations Analysis, Seventh Editi...Operations ManagementISBN:9781478623069Author:Steven Nahmias, Tava Lennon OlsenPublisher:Waveland Press, Inc.
Practical Management Science
Operations Management
ISBN:9781337406659
Author:WINSTON, Wayne L.
Publisher:Cengage,
Operations Management
Operations Management
ISBN:9781259667473
Author:William J Stevenson
Publisher:McGraw-Hill Education
Operations and Supply Chain Management (Mcgraw-hi...
Operations Management
ISBN:9781259666100
Author:F. Robert Jacobs, Richard B Chase
Publisher:McGraw-Hill Education
Purchasing and Supply Chain Management
Operations Management
ISBN:9781285869681
Author:Robert M. Monczka, Robert B. Handfield, Larry C. Giunipero, James L. Patterson
Publisher:Cengage Learning
Production and Operations Analysis, Seventh Editi...
Operations Management
ISBN:9781478623069
Author:Steven Nahmias, Tava Lennon Olsen
Publisher:Waveland Press, Inc.