
MATLAB: An Introduction with Applications
6th Edition
ISBN: 9781119256830
Author: Amos Gilat
Publisher: John Wiley & Sons Inc
expand_more
expand_more
format_list_bulleted
Related questions
Question
Given the hypothesis testing solution ,give an example for each of the Type I and Type II errors.
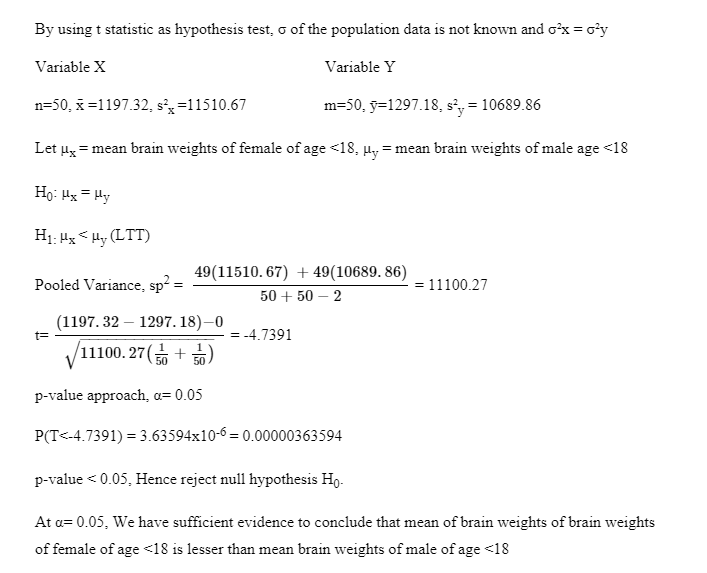

Transcribed Image Text:By using t statistic as hypothesis test, o of the population data is not known and oʻx=o°y
Variable X
Variable Y
n=50, x=1197.32, s,=11510.67
m=50, y=1297.18, s, = 10689.86
Let ug = mean brain weights of female of age <18, µ, = mean brain weights of male age <18
Ho: Hx = Hy
H1: Hx < Hy (LTT)
49(11510. 67) + 49(10689. 86)
50 + 50 – 2
Pooled Variance, sp
= 11100.27
(1197. 32 – 1297. 18)–0
t=
-4.7391
V11100. 27( + )
p-value approach, a= 0.05
P(T<-4.7391) = 3.63594x10-6= 0.00000363594
p-value < 0.05, Hence reject null hypothesis Ho.
At a= 0.05, We have sufficient evidence to conclude that mean of brain weights of brain weights
of female of age <18 is lesser than mean brain weights of male of age <18

Transcribed Image Text:Condition checking 1:
n=50 (n 230) m=50 (n 230)
The sample size, n for the brain weights of female and male of age less than 18 years old
(variable X and variable Y) is equals to 50. Sample size greater than or equals to 30 is usually
considered as a large sample.
According to the Central Limit Theorem, the sampling distribution of X and Y for a relatively
large sample size is approximately normal, irrespective of the shape of the population
distribution.
To choose a distribution, first standard deviation, o of data is checked whether is known or not
known, then whether oʻy= o, or of;+ o, is checked.
Assume that variance for Variable X and variance of Variable Y are equal
Họ: ox= o°y
Based on the value obtained in descriptive statistic:
ox=11510.67, o, = 10689.86
11510. 67
F=
10689. 86
= 1.0768
d= 49 df-49
0.05 Fo.025,49,49 = 1.6073
Since F < 1.6073, we cannot reject null hypothesis Ho
Hence, with a= 0.05, we have sufficient statistical evidence to conclude that of=o.
Since the standard deviation, o of the population data is not known and o,=o°y, t test statistic is
used.
Expert Solution
This question has been solved!
Explore an expertly crafted, step-by-step solution for a thorough understanding of key concepts.

Step by stepSolved in 3 steps

Knowledge Booster

Similar questions
- A researcher is interested in whether people are more or less likely to enjoy popcorn when they are watching TV versus watching a movie. The researcher recruits 12 participants and randomly assigns them to eat popcorn either while watching T or while watching a movie. Then, the researcher measures now much each participant enjoyed the popcorn on a scale from 1 to 10. The researchers' results are shown below: Using the appropriate hypothesis test and the six steps of hypothesis testing, see what the researcher should conclude about the effect of watching television versus watching a movie on people's enjoyment of popcorn. Construct a sampling distribution of means representing the null hypothesis. Specify the sampling distribution's mean and standard error 5. Using a two-tailed alpha of .05 (a = .05), determine the critical values 6. Calculate the test statistic 7. State whether you reject or fail to reject the null hypothesis 8. Calculate and report a measure of effect size . 9. Based…arrow_forwardPerform a hypothesis test at a 5% level of significance to see if the proportion of white individuals who are fatally shot by police is less than the total proportion of white individuals in the United States, which is approximately 60.1% according to the U.S. census bureau. State your null and alternative hypotheses in mathematical notationarrow_forwardSuppose you have a hypothesis test which never rejects the null hypothesis, no matter the value of the test statistic. Name a potential problem with such a test. Select one: a. There can be no problem with such a hypothesis test, this is the ideal scenario. b. Using this test would lead to making an excessive number of Type I errors. c. Using this test would lead to making an excessive number of Type II errors.arrow_forward
- t a nearby college, there is a school-sponsored website that matches people looking for roommates. According to the school's reports, 44% of students will find a match their first time using the site. A writer for the school newspaper tests this claim by choosing a random sample of 165 students who visited the site looking for a roommate. Of the students surveyed, 60 said they found a match their first time using the site. Complete the parts below to perform a hypothesis test to see if there is enough evidence, at the 0.10 level of significance, to reject the claim that the proportion, p , of all students who will find a match their first time using the site is 44% . erform a Z-test and find the p-value. Here is some information to help you with your Z-test. The value of the test statistic is given by −ppp−1pn . The p-value is two times the area under the curve to the left of the value of the test statistic. Standard Normal Distribution Step 1:…arrow_forwardWhich of the following are the signs which can be found in the null hypothesis? > II V VIarrow_forwardView the information below and respond accordingly. When you perform a hypothesis test, there are four possible outcomes depending on the actual truth (or falseness) of the null hypothesis H0 and the decision to reject or not. The outcomes are summarized in the following table: Table 9.2 ACTION H0 IS ACTUALLY True H0 IS ACTUALLY False Do not reject H0 Correct Outcome Type II error Reject H0 Type I Error Correct Outcomearrow_forward
- If you hypothesize that there is no difference between means, this means the alternative hypothesis is ??: ?1 = ?2 Determine whether the statement is true or false. If the statement is false, EXPLAIN why.arrow_forwardHypothesis testing with One Way ANOVA. Use hypothesis testing to answer the research questions, labeling each step and completing any post-tests. Researchers want to know if surroundings make a difference in ability to remember a list of words. They test this by randomly assigning subjects to three conditions: shopping mall setting, driving in a car setting (simulation) and in an outdoor setting. Here are the memory scores for each condition: Mall Condition Driving Condition Outdoor Condition 8 8 15 7 7 10 8 5 12 6 8 9 9 10 14 12 10 10 7 12 8 8 8 10arrow_forwardA plumber was interested in determining whether there is a significant difference in the price charged for plumbing tools by two hardware stores. The plumber selected five tools and recorded the price for each tool in each store. The following data was recorded: Store 1 2 Tool 2 R59.25 R22.50 R450 R44.25 R22.50 R36.75 R75 4 R480 R44.25 R60 Perform the appropriate test of hypothesis to determine whether there is a significant difference, on average, in the price of plumbing tools between the two stores, showing all 7 steps. Include both the rejection region and the p-value.arrow_forward
- How do you write a null hypothesis and an alternative hypothesis in words? This is the question: The survey question: On the average day, about how many hours do you personally watch television? Suppose that your reading of professional research on the topic leads to the hypothesis that, on average, adults in the US watch three hours of TV each day. I planned to use a two-sided alternative hypothesis. In symbol, my null hypothesis would be H0 : equal 3 and my alternative hypothesis would be Ha not equal 3arrow_forwardFood inspectors inspect samples of food products to see if they are safe. This can be thought of as a hypothesis test with the following hypotheses. H0: the food is safe Ha: the food is not safe The following is an example of what type of error? The sample suggests that the food is safe, but it actually is not safe. Choose one below a. type I b. type II c. not an errorarrow_forwardIn an hypothesis test the decision was made to reject the null hypothesis. The null hypothesis was later determined to be true. What kind of error, if any, was committed? Type I error Type II error No errorarrow_forward
arrow_back_ios
SEE MORE QUESTIONS
arrow_forward_ios
Recommended textbooks for you
- MATLAB: An Introduction with ApplicationsStatisticsISBN:9781119256830Author:Amos GilatPublisher:John Wiley & Sons Inc
 Probability and Statistics for Engineering and th...StatisticsISBN:9781305251809Author:Jay L. DevorePublisher:Cengage Learning
 Statistics for The Behavioral Sciences (MindTap C...StatisticsISBN:9781305504912Author:Frederick J Gravetter, Larry B. WallnauPublisher:Cengage Learning
  Elementary Statistics: Picturing the World (7th E...StatisticsISBN:9780134683416Author:Ron Larson, Betsy FarberPublisher:PEARSON
 The Basic Practice of StatisticsStatisticsISBN:9781319042578Author:David S. Moore, William I. Notz, Michael A. FlignerPublisher:W. H. Freeman
 Introduction to the Practice of StatisticsStatisticsISBN:9781319013387Author:David S. Moore, George P. McCabe, Bruce A. CraigPublisher:W. H. Freeman
MATLAB: An Introduction with Applications
Statistics
ISBN:9781119256830
Author:Amos Gilat
Publisher:John Wiley & Sons Inc
Probability and Statistics for Engineering and th...
Statistics
ISBN:9781305251809
Author:Jay L. Devore
Publisher:Cengage Learning
Statistics for The Behavioral Sciences (MindTap C...
Statistics
ISBN:9781305504912
Author:Frederick J Gravetter, Larry B. Wallnau
Publisher:Cengage Learning
Elementary Statistics: Picturing the World (7th E...
Statistics
ISBN:9780134683416
Author:Ron Larson, Betsy Farber
Publisher:PEARSON
The Basic Practice of Statistics
Statistics
ISBN:9781319042578
Author:David S. Moore, William I. Notz, Michael A. Fligner
Publisher:W. H. Freeman
Introduction to the Practice of Statistics
Statistics
ISBN:9781319013387
Author:David S. Moore, George P. McCabe, Bruce A. Craig
Publisher:W. H. Freeman