Code in python please

Operations Research : Applications and Algorithms
4th Edition
ISBN:9780534380588
Author:Wayne L. Winston
Publisher:Wayne L. Winston
Chapter12: Review Of Calculus And Probability
Section: Chapter Questions
Problem 2RP

Related questions
Question
Code in python please
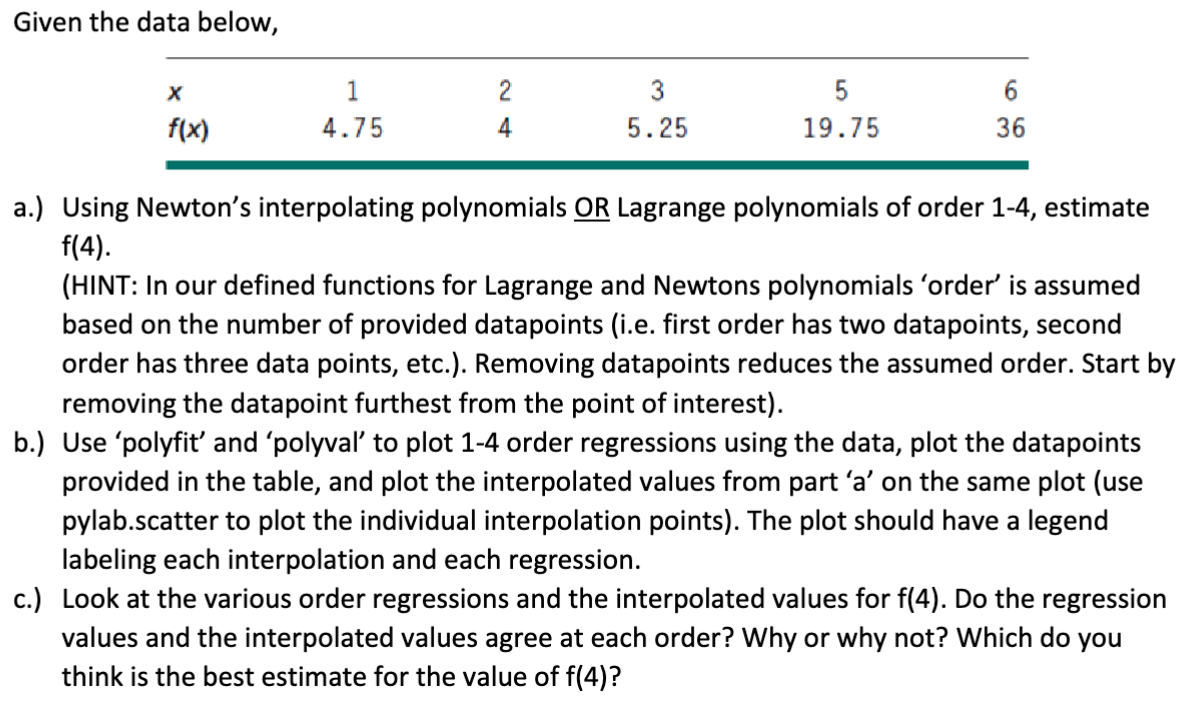
Transcribed Image Text:Given the data below,
X
f(x)
1
4.75
2
4
3
5.25
5
19.75
6
36
a.) Using Newton's interpolating polynomials OR Lagrange polynomials of order 1-4, estimate
f(4).
(HINT: In our defined functions for Lagrange and Newtons polynomials 'order' is assumed
based on the number of provided datapoints (i.e. first order has two datapoints, second
order has three data points, etc.). Removing datapoints reduces the assumed order. Start by
removing the datapoint furthest from the point of interest).
b.) Use 'polyfit' and 'polyval' to plot 1-4 order regressions using the data, plot the datapoints
provided in the table, and plot the interpolated values from part 'a' on the same plot (use
pylab.scatter to plot the individual interpolation points). The plot should have a legend
labeling each interpolation and each regression.
c.) Look at the various order regressions and the interpolated values for f(4). Do the regression
values and the interpolated values agree at each order? Why or why not? Which do you
think is the best estimate for the value of f(4)?
Expert Solution
This question has been solved!
Explore an expertly crafted, step-by-step solution for a thorough understanding of key concepts.
Step 1: Introduce polynomial regression and interpolation techniques
VIEWStep 2: a.) Estimate f(4) using Newton's interpolating polynomial and Lagrange polynomial of order 1-4:
VIEWStep 3: b.) Plot 1-4 order regressions, data points, and interpolated values:
VIEWStep 4: c.) Analysis of Regression and Interpolation Values:
VIEWSolution
VIEW
Step by step
Solved in 5 steps with 17 images

Knowledge Booster


Learn more about
Need a deep-dive on the concept behind this application? Look no further. Learn more about this topic, computer-science and related others by exploring similar questions and additional content below.Recommended textbooks for you
Operations Research : Applications and Algorithms
Computer Science
ISBN:
9780534380588
Author:
Wayne L. Winston
Publisher:
Brooks Cole
Operations Research : Applications and Algorithms
Computer Science
ISBN:
9780534380588
Author:
Wayne L. Winston
Publisher:
Brooks Cole