
MATLAB: An Introduction with Applications
6th Edition
ISBN: 9781119256830
Author: Amos Gilat
Publisher: John Wiley & Sons Inc
expand_more
expand_more
format_list_bulleted
Related questions
Concept explainers
Question
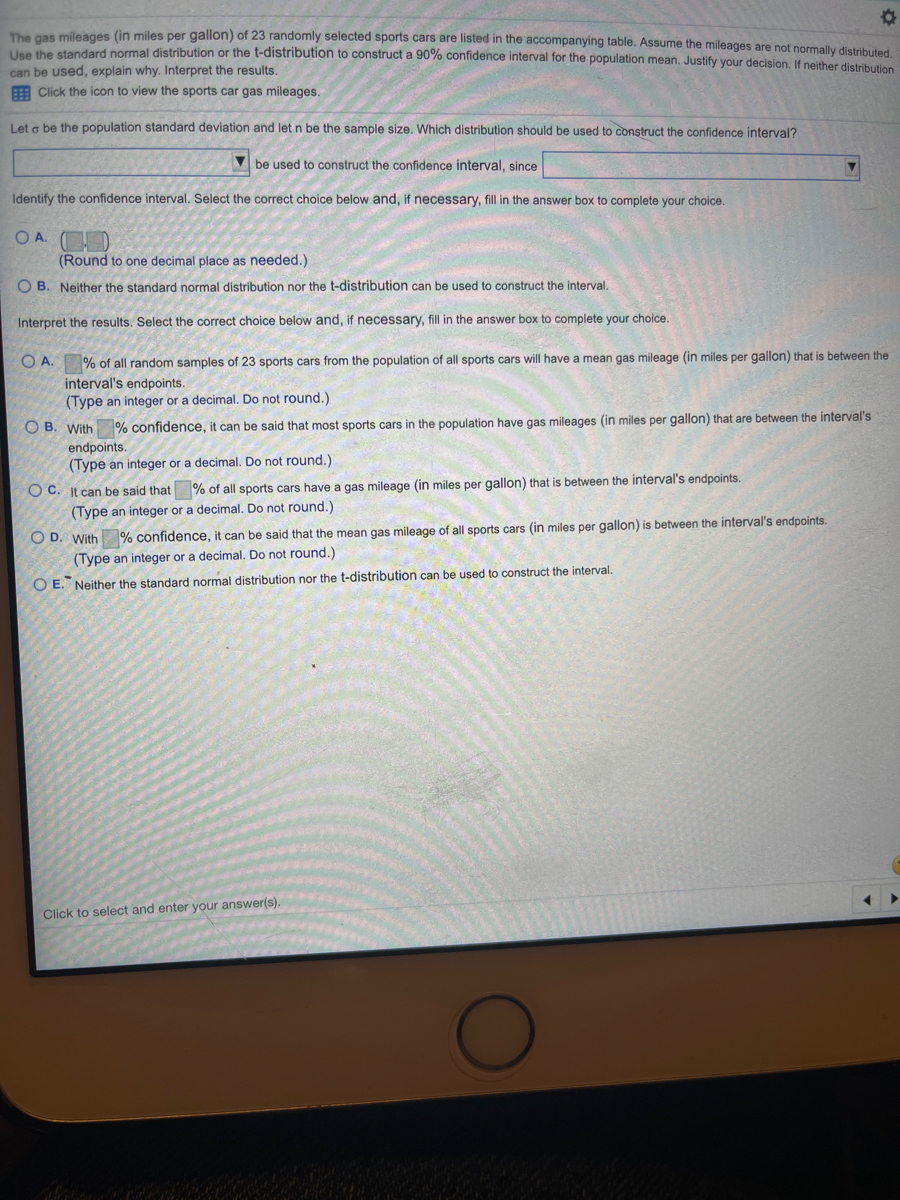

Transcribed Image Text:cen mileanes (in miles per gallon) of 23 randomly selected sports cars are listed in the accompanying table. Assume the mileages are not normally distributed
Vee the standard normal distribution or the t-distribution to construct a 90% confidence interval for the population mean. Justify your decision. If neither distribution
can be used, explain why. Interpret the results.
E Click the icon to view the sports car gas mileages.
Let a be the population standard deviation and let n be the sample size. Which distribution should be used to construct the confidence interval?
be used to construct the confidence interval, since
Identify the confidence interval. Select the correct choice below and, if necessary, fill in the answer box to complete your choice.
OA.
(Round to one decimal place as needed.)
O B. Neither the standard normal distribution nor the t-distribution can be used to construct the interval.
Interpret the results, Select the correct choice below and, if necessary, fill in the answer box to complete your cholce.
O A. % of all random samples of 23 sports cars from the population of all sports cars will have a mean gas mileage (in miles per gallon) that is between the
interval's endpoints.
(Type an integer or a decimal. Do not round.)
O B. With % confidence, it can be said that most sports cars in the population have gas mileages (in miles per gallon) that are between the interval's
endpoints.
(Type an integer or a decimal. Do not round.)
between the interval's endpoints.
O C. It can be said that % of all sports cars have a gas mileage (in miles per gallon) that
(Type an integer or a decimal. Do not round.)
O D. With % confidence, it can be said that the mean gas mileage of all sports cars (in miles per gallon) is between the interval's endpoints.
(Type an integer or a decimal. Do not round.)
O E. Neither the standard normal distribution nor the t-distribution can be used to construct the interval.
Click to select and enter your answer(s).

Transcribed Image Text:9:56 PM Sun Apr 4
A mathxl.com
令@ 25%
Sports Car Gas Mileages
23
18
32
21
21
26
20
25
23
22
25
27
18
24
27
21
30
20
23
33
28
29
23
Print
Done
s).
Expert Solution
This question has been solved!
Explore an expertly crafted, step-by-step solution for a thorough understanding of key concepts.

This is a popular solution

Trending nowThis is a popular solution!

Step by stepSolved in 2 steps with 3 images

Knowledge Booster


Learn more about
Need a deep-dive on the concept behind this application? Look no further. Learn more about this topic, statistics and related others by exploring similar questions and additional content below.Similar questions
- The incomes of math tutors in a tutoring center of a university are normally distributed with a mean of $1100 and a standard deviation of $150 what percentage of tutors earn less than $900 a montharrow_forwardUse the normal distribution of SAT critical reading scores for which the mean is 514 and the standard deviation is 115. Assume the variable x is normally distributed. (a) What percent of the SAT verbal scores are less than 650? (b) If 1000 SAT verbal scores are randomly selected, about how many would you expect to be greater than 550? Click to view page 1 of the standard normal table. LOADING... Click to view page 2 of the standard normal table. LOADING... Question content area bottom Part 1 (a) Approximately 1.181.18% of the SAT verbal scores are less than 650. (Round to two decimal places as needed.) Part 2 (b) You would expect that approximately 0.880.88 SAT verbal scores would be greater than 550. (Round to the nearest whole number as needed.)arrow_forwardAssume the samples are random and independent, the populations are nomally distributed, and the population variances are equal. The table available below shows the prices (in dollars) for a sample of automobile batteries. The prices are classified according to battery type. At a = 0.10, is there enough evidence conclude that at least one mean battery price is different from the others? Complete parts (a) through (e) below. E Click the icon to view the battery cost data. (a) Let u1. P2. H3 represent the mean prices for the group size 35, 65, and 24/24F respectively. Identify the claim and state Ho and H. H Cost of batteries by type The claim is the V hypothesis. Group size 35 Group size 65 Group size 24/24F 101 111 121 124 D 146 173 182 278 124 140 141 89 (b) Find the critical value, Fo, and identify the rejection region. 90 79 84 The rejection region is F Fo, where Fo = (Round to two decimal places as needed.) (c) Find the test statistic F. Print Done F= (Round to two decimal places as…arrow_forward
- A physical fitness trainer has several workouts she developed for increasing female upper body strength. All the workout plans are created based on the average adult women’s bench press ability. The average adult woman can bench 115 lbs. with a standard deviation of 18 pounds. The trainer has a class of 14 females and does an initial test to see if the women are representative of the average female population. Data Female Class Bench Ability (lbs.) 1 130 2 100 3 99 4 114 5 130 6 97 7 114 8 135 9 128 10 128 11 116 12 141 13 113 14 116 Write the null and alternative hypothesis in statistical form: Determine the mean for the sample: Apply the z-test formula Zobt = Is this a one-tailed (directional test) or a two-tailed (non-directional test)? What is your alpha level set to? α = Label the critical value(s) and indicate the position of the Zobt on the distribution…arrow_forwardThe distribution of heights in a population of women is approximately normal. Sixteen percent of the women have heights less than 62 inches. About 97.5% of the women have heights less than 71 inches. Use the empirical rule to estimate the mean and standard deviation of the heights in this population. Mean: K inches Standard Deviation: inchesarrow_forwardUse the Empirical Rule. The mean speed of a sample of vehicles along a stretch of highway per hour and 85 miles per hour. (Assume the data set has a bell-shaped distribution.) 70 miles per hour, with a standard deviation of 5 miles per hour. Estimate the percent of vehicles whese speeds are between 55 miles Approximately% of vehicles travel between 55 miles per hour and 85 miles per hour.arrow_forward
- Use the Empirical Rule. The mean speed of a sample of vehicles along a stretch of highway is 68 miles per hour, with a standard deviation of 3 miles per hour. Estimate the percent of vehicles whose speeds are between 65 miles per hour and 71 miles per hour. (Assume the data set has a bell-shaped distribution.) Approximately nothing% of vehicles travel between 65 miles per hour and 71 miles per hour.arrow_forwardEmergencyarrow_forwardWhat is the correct way to report the results in APA stylearrow_forward
- z Scores LeBron James, one of the most successful basketball players of all time, has a height of 6 feet 8 inches, or 203 cm. Based on statistics from Data Set 1 “Body Data” in Appendix B, his height converts to the z score of 4.07. How many standard deviations is his height above the mean?arrow_forwardScore last try: pts. See Details for more. You can retry this question below For a 4-unit class like Statistics, students should spend average of 12 hours studying for the class. A survey was done on 28 students, and the distribution of total study hours per week is bell-shaped with a mean of 13 hours and a standard deviation of 3.1 hours. Use the Empirical Rule to answer the following questions. a) 68% of the students spend between 12.41 X hours and 13.58 x hours on Statistics each week. b) 95% of the students spend between 11.82 X hours and 14.7 X hours on Statistics each week. c) 99.7% of the students spend between 11.24 X hours and 14.76 X hours on Statistics each week.arrow_forwardExplain the circumstances for which the interquartile range is the preferred measure of dispersion. What is an advantage that the standard deviation has over the interquartile range? Choose the correct answer below. A. The interquartile range is preferred when the data are bell shaped. An advantage of the standard deviation is that it increases as the dispersion of the data increases. B. The interquartile range is preferred when the distribution is symmetric. An advantage of the standard deviation is that it is resistant to extreme values. C. The interquartile range is preferred when the data are skewed or have outliers. An advantage of the standard deviation is that it uses all the observations in its computation. D. The interquartile range is preferred when the data are bell shaped. An advantage of the standard deviation is that it is resistant to extreme values. E. The interquartile range is preferred when the data are not skewed or no have…arrow_forward
arrow_back_ios
arrow_forward_ios
Recommended textbooks for you
- MATLAB: An Introduction with ApplicationsStatisticsISBN:9781119256830Author:Amos GilatPublisher:John Wiley & Sons Inc
 Probability and Statistics for Engineering and th...StatisticsISBN:9781305251809Author:Jay L. DevorePublisher:Cengage Learning
 Statistics for The Behavioral Sciences (MindTap C...StatisticsISBN:9781305504912Author:Frederick J Gravetter, Larry B. WallnauPublisher:Cengage Learning
  Elementary Statistics: Picturing the World (7th E...StatisticsISBN:9780134683416Author:Ron Larson, Betsy FarberPublisher:PEARSON
 The Basic Practice of StatisticsStatisticsISBN:9781319042578Author:David S. Moore, William I. Notz, Michael A. FlignerPublisher:W. H. Freeman
 Introduction to the Practice of StatisticsStatisticsISBN:9781319013387Author:David S. Moore, George P. McCabe, Bruce A. CraigPublisher:W. H. Freeman
MATLAB: An Introduction with Applications
Statistics
ISBN:9781119256830
Author:Amos Gilat
Publisher:John Wiley & Sons Inc
Probability and Statistics for Engineering and th...
Statistics
ISBN:9781305251809
Author:Jay L. Devore
Publisher:Cengage Learning
Statistics for The Behavioral Sciences (MindTap C...
Statistics
ISBN:9781305504912
Author:Frederick J Gravetter, Larry B. Wallnau
Publisher:Cengage Learning
Elementary Statistics: Picturing the World (7th E...
Statistics
ISBN:9780134683416
Author:Ron Larson, Betsy Farber
Publisher:PEARSON
The Basic Practice of Statistics
Statistics
ISBN:9781319042578
Author:David S. Moore, William I. Notz, Michael A. Fligner
Publisher:W. H. Freeman
Introduction to the Practice of Statistics
Statistics
ISBN:9781319013387
Author:David S. Moore, George P. McCabe, Bruce A. Craig
Publisher:W. H. Freeman