Concept explainers
Students should spend average of 12 hours studying. Survey done on 25 students and the distribution of total study hours per week is bell-shaped with a
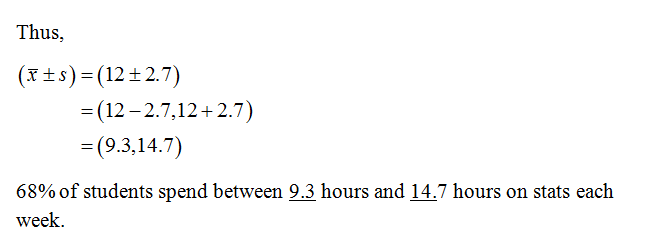
68% of students spend between ? hours and ? hours on stats each week
95% of students spend between ? hours and ? hours on stats each week.
99.7% of students spend between ? hours and ? hours on stats each week.
The provided information are:

According to the empirical rule:
Approximately 68% of the data values fall within one standard deviation of mean.
Approximately 95% of the data values fall within two standard deviations of mean.
Approximately 99.7% of the data values fall within three standard deviations of mean.
(a)
It is known that 68% of the data lies within one standard deviations of the mean.

Step by stepSolved in 5 steps with 4 images

- Suppose the annual employer 401K cost per participant is normally distributed with a mean of $770. If 73.89% of such costs are greater than $370, what is the standard deviation of the annual employer 401K cost per participant?arrow_forwardWhat percentage of computer programmer major received a starting offer between $32000 and $38000? (mean of $39,269) (standard deviation of $2550)arrow_forwardThe commute time for Cypress College students who drive from their home to the college follows a normal distribution with a mean of 26 minutes and a standard deviation of 8 minutes. If it takes a student 15 minutes to get to school, what would the percentile ranking for this student's commute time be? O 31st percentile 92nd percentile 8th percentile 77th percentile 23rd percentilearrow_forward
- Wisconsin ACT math The histogram shows the dis-tribution of mean ACT mathematics scores for all Wisconsin public schools in 2011. The vertical linesshow the mean and one standard deviation above andbelow the mean. 78.8% of the data points are betweenthe two outer lines. a) Give two reasons that a Normal model is not appropri-ate for these data.b) The lower cluster, that is, the scores less thanabout 17, is almost entirely made up of schoolsin the Milwaukee school district. If those scoresare removed, what would be the shape of the newdistribution? What would happen to the mean andstandard deviation?arrow_forwarda commuter travels many miles to work each morning she has timed this trip 5 times during the last month the time ( in minutes ) required to make this trip was 38, 33, 36, 47,& 41. what is the standard deviation for this sample data Options are 28.5 11 22.8 5.34arrow_forward35 36 CetaceaNow is a conservationist organization that monitors the health of whale and dolphin populations worldwide. As part of their work, they are modelling the lengths of blue whale calves that will be born over the next decade. For their model, CetaceaNow is using a normal distribution with a mean of 277 in and a standard deviation of 40 in. Use this table or the ALEKS calculator to find the percentage of blue whale calves with a length of between 203 in and 251 in according to the model. For your intermediate computations, use four or more decimal places. Give your final answer to two decimal places (for example 98.23%). % Submit Assignmer Continuearrow_forward
- Which data set would be likely to have the larger standard deviation? Explain. * * Data set 1: Weights of all dogs at a golden retriever rescue shelter * Data set 2: Weights of all dogs for sale in a pet shop.arrow_forwardwhat is the mean and standard deviation of the following sample: 18, 1, 5, 1, 5arrow_forwardA health professional is whether stress level before a routine practice session can be used to predict the mean stress level a major figure skating competition. The health professional selected a random sample of figure skaters and measured the stress level before a routine practice session and before a major competitionEach variable was measured as the change in the interval between heartbeats , or heart rate variability . The health professional wants to estimate the mean change in the stress level before a major competition for each unit increase in the stress level before a routine practice.arrow_forward
- Create a collection of 7-12 numbers of your choice (e.g., 4, 9, 13, 2, 7, 8, 6, 10). Find the following quantitative measures of variability: Range Sample Variance Sample Standard Deviationarrow_forward13) Scores for a civil service exam are normally distributed, with a mean of 75 and a standard deviation of 6.5. To be eligible for civil service employment, you must score in the top 5% . What is the lowest score you can earn and still be eligible for the employment? a. Graph b. Score:arrow_forwardThe incomes of math tutors in a tutoring center of a university are normally distributed with a mean of $1100 and a standard deviation of $150 what percentage of tutors earn less than $900 a montharrow_forward
 MATLAB: An Introduction with ApplicationsStatisticsISBN:9781119256830Author:Amos GilatPublisher:John Wiley & Sons Inc
 Probability and Statistics for Engineering and th...StatisticsISBN:9781305251809Author:Jay L. DevorePublisher:Cengage Learning
 Statistics for The Behavioral Sciences (MindTap C...StatisticsISBN:9781305504912Author:Frederick J Gravetter, Larry B. WallnauPublisher:Cengage Learning
 Elementary Statistics: Picturing the World (7th E...StatisticsISBN:9780134683416Author:Ron Larson, Betsy FarberPublisher:PEARSON
 The Basic Practice of StatisticsStatisticsISBN:9781319042578Author:David S. Moore, William I. Notz, Michael A. FlignerPublisher:W. H. Freeman
 Introduction to the Practice of StatisticsStatisticsISBN:9781319013387Author:David S. Moore, George P. McCabe, Bruce A. CraigPublisher:W. H. Freeman


