
MATLAB: An Introduction with Applications
6th Edition
ISBN: 9781119256830
Author: Amos Gilat
Publisher: John Wiley & Sons Inc
expand_more
expand_more
format_list_bulleted
Related questions
Question
Pick one method to be used:
- Chi-Square Test
- Mann Whitney U Test
- Spearman Rank and Friedman Test
- Mc Nemar’s Test for
Correlated Proportions - Kendall’s Coefficient of Concordance W
- Kolmogorov-Smirnov Test
After picking one method to be used, answer the following:
What test method to be used:
Computed Value:
Tabular Value:
Conclusion:
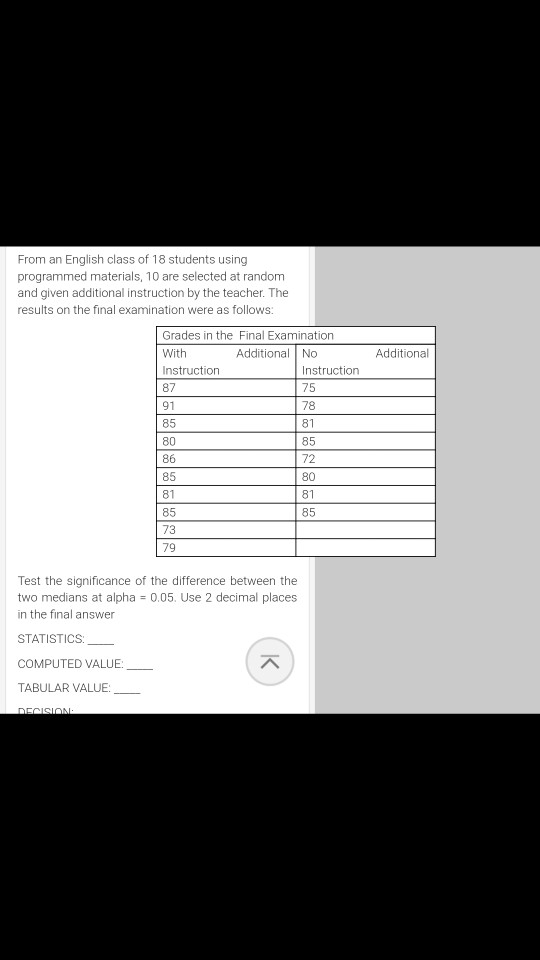

Transcribed Image Text:From an English class of 18 students using
programmed materials, 10 are selected at random
and given additional instruction by the teacher. The
results on the final examination were as follows:
Grades in the Final Examination
With
Additional No
Additional
Instruction
Instruction
87
75
91
78
85
81
80
85
86
72
85
80
81
81
85
85
73
79
Test the significance of the difference between the
two medians at alpha = 0.05. Use 2 decimal places
in the final answer
STATISTICS:
COMPUTED VALUE:
TABULAR VALUE:
DECISION
Expert Solution
This question has been solved!
Explore an expertly crafted, step-by-step solution for a thorough understanding of key concepts.

This is a popular solution

Trending nowThis is a popular solution!

Step by stepSolved in 3 steps

Knowledge Booster


Learn more about
Need a deep-dive on the concept behind this application? Look no further. Learn more about this topic, statistics and related others by exploring similar questions and additional content below.Similar questions
- A knewton.com Question The following data was calculated during a study on customer experience. Use the following information to find the test statistic and p-value at a 10% level of significance: • The claim is that the percent of companies that view customer experience as the most vital component of a growing business is different than 50%. Sample size = 50 companies • Sample proportion = 0.40 Use the table or the curve below to find the test statistic and p-value. For the curve select the appropriate test by dragging the blue point to a right-, left- or two-tailed diagram, then set the sliders. Use the purple slider to set the significance level. Use the black sliders to set the information from the study described above. z 0.00 0.01 0.02 0.03 0.04 0.05 0.06 0.07 0.08 0.09 |-1.5 0.067 0.0660.064 0.063 0.062 0.061 0.059 o.058 0.057 0.056 -1.40.081 0.0790.078 0.076 0.075 0.074 0.072 0.071 0.069 0.068 |-1.3 0.097 0.095 0.093 0.092 0.090 0.089 0.087 0.085 0.084 0.082 -1.2 0.115…arrow_forwardIf we want to compare average charges for males and females, we would use O two sample z- test O single sample t-test O Correlation OTwo sample t-testarrow_forward16 Co 27 H 9. Question Details BONUS Round to nearest tenth Sample Answer: 4.2arrow_forward
- I need help for figuring out how to explain parts a and b.arrow_forwardThe type of household for the U.S. population and for a random sample of 411 households from a community in Montana are shown below. Type of Household Percent of U.S.Households Observed Numberof Households inthe Community Married with children 26% 92 Married, no children 29% 121 Single parent 9% 31 One person 25% 102 Other (e.g., roommates, siblings) 11% 65 A) Find the value of the chi-square statistic for the sample. (Round the expected frequencies to two decimal places. Round the test statistic to three decimal places.) B)Find or estimate the P-value of the sample test statistic. (Round your answer to three decimal places.)arrow_forwardView the attatched photo and select the correct answer for A. Then look at the questions below (B and C) and answer those using the data oe information in the photo. A) Answer A which is in the photo. B) Calculate the standardized test statistic. T = ? C) Calculate the P-value. P = ?arrow_forward
- The densities of several common metals are shown in the following table. Metal Density (g/cm³) iron 7.87 silver 10.49 lead 11.36 zinc 7.13 aluminum 2.70 For her chemistry lab, Kamila needs to identify three metal samples by density. The data she collected is shown in the following table. The metal samples are all rectangular prisms.arrow_forwardTo test whether the mean time needed to mix a batch of material is the same for machines produced by three manufacturers, the Jacobs Chemical Company obtained the following data on the time (in minutes) needed to mix the material. Compute the values below (to 2 decimals, if necessary). Sum of Squares, Treatment Sum of Squares, Error a. Use these data to test whether the population mean times for mixing a batch of material differ for the three manufacturers. Use a = 0.05. Mean Squares, Treatment 0000 Mean Squares, Error Calculate the value of the test statistic (to 2 decimals). 1 17 23 21 19 What conclusion can you draw after carrying out this test? - Select your answer - Manufacturer 2 28 26 31 27 + 3 18 17 21 20 The p-value is - Select your answer - What is your conclusion? - Select your answer - b. At the a = 0.05 level of significance, use Fisher's LSD procedure to test for the equality of the means for manufacturers 1 and 3. Calculate Fisher's LSD Value (to 2 decimals).arrow_forward
arrow_back_ios
arrow_forward_ios
Recommended textbooks for you
- MATLAB: An Introduction with ApplicationsStatisticsISBN:9781119256830Author:Amos GilatPublisher:John Wiley & Sons Inc
 Probability and Statistics for Engineering and th...StatisticsISBN:9781305251809Author:Jay L. DevorePublisher:Cengage Learning
 Statistics for The Behavioral Sciences (MindTap C...StatisticsISBN:9781305504912Author:Frederick J Gravetter, Larry B. WallnauPublisher:Cengage Learning
  Elementary Statistics: Picturing the World (7th E...StatisticsISBN:9780134683416Author:Ron Larson, Betsy FarberPublisher:PEARSON
 The Basic Practice of StatisticsStatisticsISBN:9781319042578Author:David S. Moore, William I. Notz, Michael A. FlignerPublisher:W. H. Freeman
 Introduction to the Practice of StatisticsStatisticsISBN:9781319013387Author:David S. Moore, George P. McCabe, Bruce A. CraigPublisher:W. H. Freeman
MATLAB: An Introduction with Applications
Statistics
ISBN:9781119256830
Author:Amos Gilat
Publisher:John Wiley & Sons Inc
Probability and Statistics for Engineering and th...
Statistics
ISBN:9781305251809
Author:Jay L. Devore
Publisher:Cengage Learning
Statistics for The Behavioral Sciences (MindTap C...
Statistics
ISBN:9781305504912
Author:Frederick J Gravetter, Larry B. Wallnau
Publisher:Cengage Learning
Elementary Statistics: Picturing the World (7th E...
Statistics
ISBN:9780134683416
Author:Ron Larson, Betsy Farber
Publisher:PEARSON
The Basic Practice of Statistics
Statistics
ISBN:9781319042578
Author:David S. Moore, William I. Notz, Michael A. Fligner
Publisher:W. H. Freeman
Introduction to the Practice of Statistics
Statistics
ISBN:9781319013387
Author:David S. Moore, George P. McCabe, Bruce A. Craig
Publisher:W. H. Freeman