A First Course in Probability (10th Edition)
10th Edition
ISBN: 9780134753119
Author: Sheldon Ross
Publisher: PEARSON
expand_more
expand_more
format_list_bulleted
Question

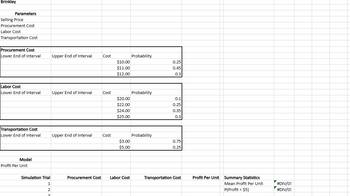
Transcribed Image Text:Brinkley
Parameters
Selling Price
Procurement Cost
Labor Cost
Transportation Cost
Procurement Cost
Lower End of Interval
Labor Cost
Lower End of Interval
Transportation Cost
Lower End of Interval
Model
Profit Per Unit
Simulation Trial
1
2
3
Upper End of Interval
Upper End of Interval
Upper End of Interval
Procurement Cost
Cost
Cost
Cost
$10.00
$11.00
$12.00
$20.00
$22.00
$24.00
$25.00
$3.00
$5.00
Labor Cost
Probability
Probability
Probability
0.25
0.45
0.3
0.1
0.25
0.35
0.3
0.75
0.25
Transportation Cost
Profit Per Unit Summary Statistics
Mean Profit Per Unit
P(Profit < $5)
▼
#DIV/0!
#DIV/0!

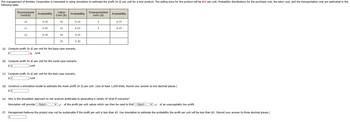
Transcribed Image Text:The management of Brinkley Corporation is interested in using simulation to estimate the profit (in $) per unit for a new product. The selling price for the product will be $46 per unit. Probability distributions for the purchase cost, the labor cost, and the transportation cost are estimated in the
following table.
Procurement
Cost($)
10
11
12
Probability
0.25
4
0.45
0.30
Labor
Cost ($)
20
22
24
25
Probability
0.10
0.25
0.35
0.30
(a) Compute profit (in $) per unit for the base-case scenario.
$
x /unit
(b) Compute profit (in $) per unit for the worst-case scenario.
$4
/unit
(c) Compute profit (in $) per unit for the best-case scenario.
/unit
Transportation Probability
Cost ($)
3
5
0.75
0.25
(d) Construct a simulation model to estimate the mean profit (in $) per unit. (Use at least 1,000 trials. Round your answer to two decimal places.)
(e) Why is the simulation approach to risk analysis preferable to generating a variety of what-if scenarios?
Simulation will provide ---Select--- ✓✓ of the profit per unit values which can then be used to find ---Select---
✓ of an unacceptably low profit.
(f) Management believes the project may not be sustainable if the profit per unit is less than $5. Use simulation to estimate the probability the profit per unit will be less than $5. (Round your answer to three decimal places.)
Expert Solution
This question has been solved!
Explore an expertly crafted, step-by-step solution for a thorough understanding of key concepts.
This is a popular solution
Trending nowThis is a popular solution!
Step by stepSolved in 2 steps

Follow-up Questions
Read through expert solutions to related follow-up questions below.
Follow-up Question

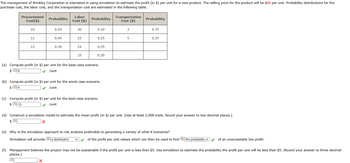
Transcribed Image Text:The management of Brinkley Corporation is interested in using simulation to estimate the profit (in $) per unit for a new product. The selling price for the product will be $46 per unit. Probability distributions for the
purchase cost, the labor cost, and the transportation cost are estimated in the following table.
Procurement
Cost($)
10
11
12
7
Probability
0.25
0.45
X
0.30
Labor
Cost ($)
20
X
22
24
25
Probability
0.10
0.25
(a) Compute profit (in $) per unit for the base-case scenario.
$18
/unit
0.35
(b) Compute profit (in $) per unit for the worst-case scenario.
$ 2 4
/unit
0.30
(c) Compute profit (in $) per unit for the best-case scenario.
$313
✓ /unit
Transportation
Cost ($)
3
5
Probability
(d) Construct a simulation model to estimate the mean profit (in $) per unit. (Use at least 1,000 trials. Round your answer to two decimal places.)
$
0.75
0.25
(e) Why is the simulation approach to risk analysis preferable to generating a variety of what-if scenarios?
Simulation will provide 5 a distribution
of the profit per unit values which can then be used to find the probability
(f) Management believes the project may not be sustainable if the profit per unit is less than $5. Use simulation to estimate the probability the profit per unit will be less than $5. (Round your answer to three decimal
places.)
of an unacceptably low profit.

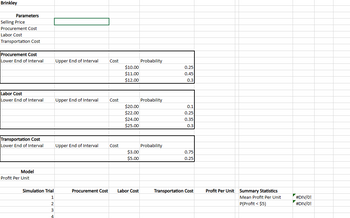
Transcribed Image Text:Brinkley
Parameters
Selling Price
Procurement Cost
Labor Cost
Transportation Cost
Procurement Cost
Lower End of Interval
Labor Cost
Lower End of Interval
Transportation Cost
Lower End of Interval
Model
Profit Per Unit
Simulation Trial
1
2
3
4
Upper End of Interval
Upper End of Interval
Upper End of Interval
Procurement Cost
Cost
Cost
Cost
$10.00
$11.00
$12.00
$20.00
$22.00
$24.00
$25.00
$3.00
$5.00
Labor Cost
Probability
Probability
Probability
0.25
0.45
0.3
0.1
0.25
0.35
0.3
0.75
0.25
Transportation Cost
Profit Per Unit Summary Statistics
Mean Profit Per Unit
P(Profit < $5)
#DIV/0!
#DIV/0!
Solution
by Bartleby Expert
Follow-up Questions
Read through expert solutions to related follow-up questions below.
Follow-up Question

Transcribed Image Text:The management of Brinkley Corporation is interested in using simulation to estimate the profit (in $) per unit for a new product. The selling price for the product will be $46 per unit. Probability distributions for the
purchase cost, the labor cost, and the transportation cost are estimated in the following table.
Procurement
Cost($)
10
11
12
7
Probability
0.25
0.45
X
0.30
Labor
Cost ($)
20
X
22
24
25
Probability
0.10
0.25
(a) Compute profit (in $) per unit for the base-case scenario.
$18
/unit
0.35
(b) Compute profit (in $) per unit for the worst-case scenario.
$ 2 4
/unit
0.30
(c) Compute profit (in $) per unit for the best-case scenario.
$313
✓ /unit
Transportation
Cost ($)
3
5
Probability
(d) Construct a simulation model to estimate the mean profit (in $) per unit. (Use at least 1,000 trials. Round your answer to two decimal places.)
$
0.75
0.25
(e) Why is the simulation approach to risk analysis preferable to generating a variety of what-if scenarios?
Simulation will provide 5 a distribution
of the profit per unit values which can then be used to find the probability
(f) Management believes the project may not be sustainable if the profit per unit is less than $5. Use simulation to estimate the probability the profit per unit will be less than $5. (Round your answer to three decimal
places.)
of an unacceptably low profit.

Transcribed Image Text:Brinkley
Parameters
Selling Price
Procurement Cost
Labor Cost
Transportation Cost
Procurement Cost
Lower End of Interval
Labor Cost
Lower End of Interval
Transportation Cost
Lower End of Interval
Model
Profit Per Unit
Simulation Trial
1
2
3
4
Upper End of Interval
Upper End of Interval
Upper End of Interval
Procurement Cost
Cost
Cost
Cost
$10.00
$11.00
$12.00
$20.00
$22.00
$24.00
$25.00
$3.00
$5.00
Labor Cost
Probability
Probability
Probability
0.25
0.45
0.3
0.1
0.25
0.35
0.3
0.75
0.25
Transportation Cost
Profit Per Unit Summary Statistics
Mean Profit Per Unit
P(Profit < $5)
#DIV/0!
#DIV/0!
Solution
by Bartleby Expert
Knowledge Booster
Similar questions
- Suppose that you are offered the following "deal." You roll a six sided die. If you roll a 6, you win $11. If you roll a 4 or 5, you win $1. Otherwise, you pay $7.a. Complete the PDF Table. List the X values, where X is the profit, from smallest to largest. Round to 4 decimal places where appropriate. Probability Distribution Table X P(X) b. Find the expected profit. $ ______ (Round to the nearest cent)c. Interpret the expected value. If you play many games you will likely lose on average very close to $1.33 per game. This is the most likely amount of money you will win. You will win this much if you play a game. d. Based on the expected value, should you play this game? Yes, because you can win $11.00 which is greater than the $7.00 that you can lose. Yes, since the expected value is positive, you would be very likely to come home with more money if you played many games. Yes, since the expected value is 0, you would be very likely to come very close…arrow_forward1. The following probability tree characterizes prospects that may occur after choosing a given alternative. The profit (expressed in thousands of dollars) is presented at the end of the tree. K $ 30 High Demand 0.3 0.7 Low Demand High Cost 0.2 {Profit = 30 K$|& } 0.8 Low Cost High Cost 0.5 0.5 Low Cost a. Plot the probability mass function for profit b. Plot the cumulative probability for profit. c. Plot the excess cumulative probability for profit. d. Determine: Sun 0.6 0.4 Rain Sun 0.6 0.4 Rain Sun 0.6 0.4 Rain Sun 0.6 0.4 Rain 40 100 110 -10 0 20 30arrow_forwardI've been stuck on this question all day and need help solving it, thanks so mucharrow_forward
- 20.20 Life insurance. You might sell insurance to a 20-year-old friend. The probability that a man aged 20 will die in the next year is about 0.0007. You decide to charge $2000 for a policy that will pay $1 million if your friend dies. a. What is your expected profit on this policy? b. Although you expect to make a good profit, you would be foolish to sell a single policy only to your friend. Why? c. A life insurance company that sells thousands of policies, on the other hand, would do very well selling policies on exactly these same terms. Explain whyarrow_forward# Airlines and hotels often grant reservations in excess of capacity to minimize losses due to no- shows. Suppose the records of a hotel show that 3% of their prospective guests will not claim their reservation. If the hotel accepts 210 reservations and there are only 200 rooms in the hotel, what is the probability that all guests who arrive to claim a room will receive one? a 0.0985 0.6255 0.9207 0.0045 0.9960 $ 0 % < A & W D P cricutarrow_forward4. In operations management, you learn that intermittent systems produce a variety of products one at a time (or in batches) to customer order. These systems contrast with continuous systems, in which a large number of homogeneous products are produced. One feature of intermittent systems is that new orders arrive at irregular intervals. For example, orders for business letterhead may come into the Ben Franklin Print Shop at the rate of .5 per day. What is the probability that the time between two orders is less than one day?arrow_forward
- Suppose 58.8% of small businesses experience cash flow problems in their first 5 years. A consultant takes a random sample of 557 businesses that have been opened for 5 years or less. What is the probability that greater than 55.85% of the businesses have experienced cash flow problems? Question 2 options: 1) 0.9214 2) 0.5000 3) -6.0341 4) 0.0786 5) >0.999arrow_forwardA product is ordered once each year, and the reorder point without safety stock (dL) is 100 units. Inventory carrying cost is $10 per unit per year, and the cost of a stockout is $50 per year. Given the following demand probabilities during the reorder period, how much safety stock should be carried? DEMAND DURING REORDER PERIOD PROBABILITY 0. .1 50 .2 A 100 150 .2 .4 ROP 200 .1 Please show it by working.arrow_forwardThe following represents the probability distribution for the daily demand of microcomputers at a local store. Demand Probability 0 .1 1 .2 2 .3 3 .2 4 .2 The expected daily demand is _____. a. 1.0 b. 2 c. 2.2 d. 4arrow_forward
- 2. Statistical measures of stand-alone risk Remember, the expected value of a probability distribution is a statistical measure of the average (mean) value expected to occur during a possible circumstances. To compute an asset's expected return under a range of possible circumstances (or states of nature), multiply the anticipated return expected to result during each state of nature by its probability of occurrence. Consider the following case: Ethan owns a two-stock portfolio that invests in Happy Dog Soap Company (HDS) and Black Sheep Broadcasting (BSB). Three- quarters of Ethan's portfolio value consists of HDS's shares, and the balance consists of BSB's shares. Each stock's expected return for the next year will depend on forecasted market conditions. The expected returns from the stocks in different market conditions are detailed in the following table: Market Condition Probability of Occurrence Happy Dog Soap Black Sheep Broadcasting Strong 0.50 50% 70% Normal 0.25 30% 40% Weak…arrow_forwardThe management of Brinkley Corporation is interested in using simulation to estimate the profit per unit for a new product. The selling price for the product will be $45 per unit. Probability distributions for the purchase cost, the labor cost, and the transportation cost are estimated as follows: Procurement Cost ($) Probability Labor Cost ($) Probability Transportation Cost ($) Probability 10 0.25 20 0.10 3 0.75 11 0.45 22 0.25 5 0.25 12 0.30 24 0.35 25 0.30 Compute profit per unit for the base-case, worst-case, and best-case scenarios. Construct a simulation model to estimate the mean profit per unit. Why is the simulation approach to risk analysis preferable to generating a variety of what-if scenarios? Management believes the project may not be sustainable if the profit per unit is less than $5. Use simulation to estimate the probability the profit per unit will be less than $5.arrow_forwardQuestion 5: A department store prints scratch-and-save discount coupons to distribute to its customers. The numbers for each present discount are shown in the table. Present Discount Number of Each type of discount Available 60% 50 50% 25000 30% 50000 10% 500,000 Determine the expected percent discount. Question 6: An examination consists of 50 multiple-choice items, each with 4 possible answers. what is the probability of guessing 25 or more correct answers? Question 7: A. bank found that 25% of its loans to new small business become delinquent. Ten small business are selected randomly from the bank's files. a) what is probability that three of them are delinquent? b) what is the probability that at least three of them are delinquent? c) what is the expected delinquency? B. Geometric Distribution Q8: Explain why rolling a die until 3 shows can be modelled by a geometric distributionarrow_forward
arrow_back_ios
SEE MORE QUESTIONS
arrow_forward_ios
Recommended textbooks for you
 A First Course in Probability (10th Edition)ProbabilityISBN:9780134753119Author:Sheldon RossPublisher:PEARSON

A First Course in Probability (10th Edition)
Probability
ISBN:9780134753119
Author:Sheldon Ross
Publisher:PEARSON
