
MATLAB: An Introduction with Applications
6th Edition
ISBN: 9781119256830
Author: Amos Gilat
Publisher: John Wiley & Sons Inc
expand_more
expand_more
format_list_bulleted
Related questions
Question
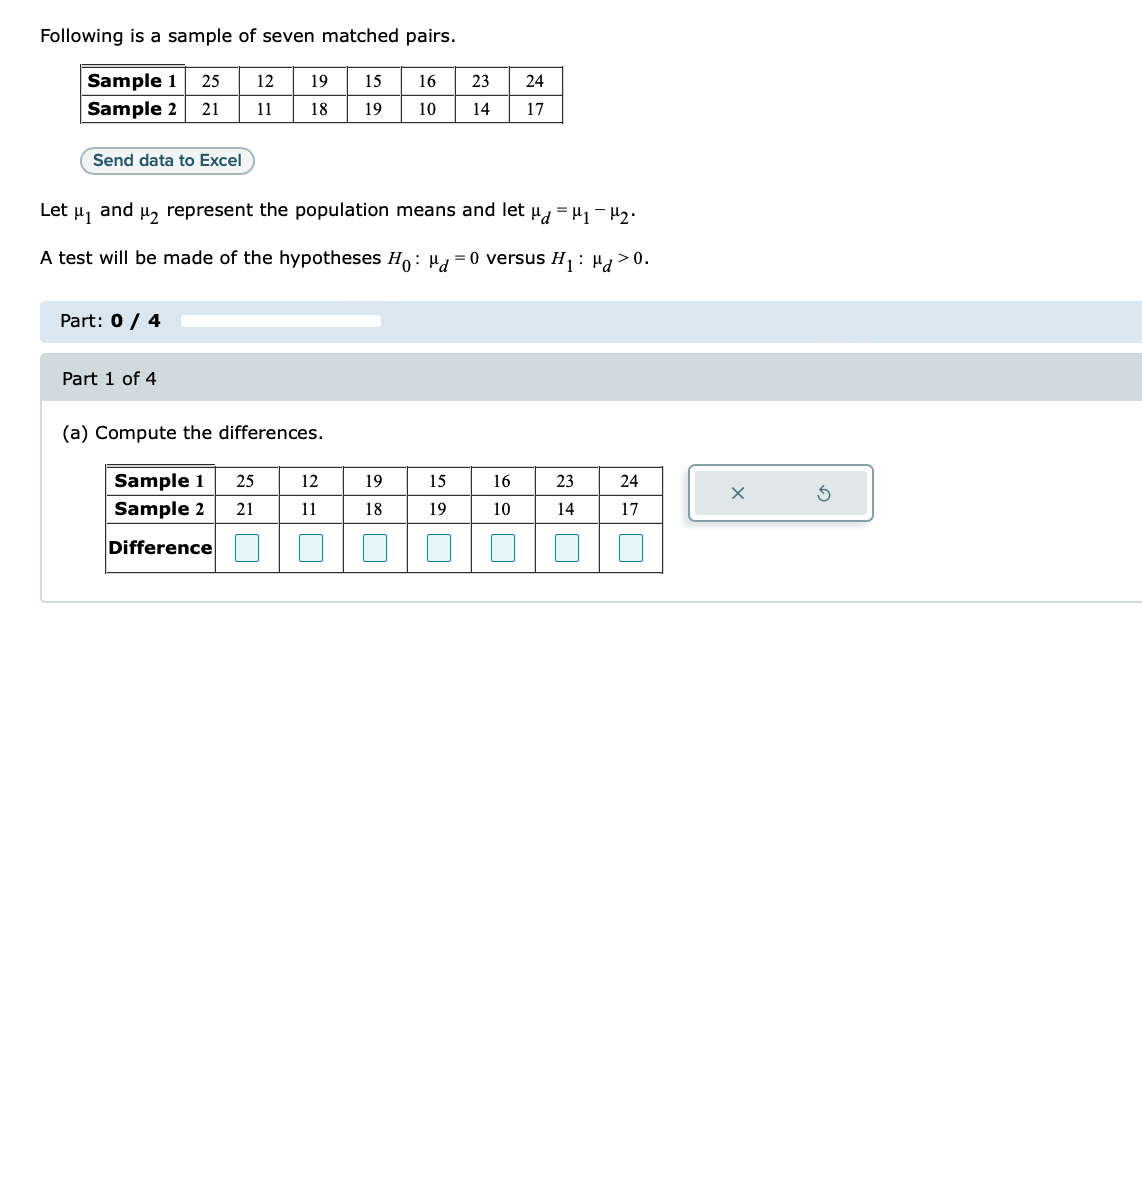

Transcribed Image Text:Following is a sample of seven matched pairs.
Sample 1 25 12
Sample 2 21
11
Send data to Excel
Part: 0 / 4
19
18
Part 1 of 4
Let H1
A test will be made of the hypotheses Ho: H=0 versus H₁: Hd >0.
(a) Compute the differences.
Sample 1
Sample 2
Difference
25
21
15
19
and μ₂ represent the population means and let μμ₁-4₂.
12
11
16
10
19
18
U
23
14
199
15
24
17
16
10
U
23
14
I
U
24
17
Expert Solution
This question has been solved!
Explore an expertly crafted, step-by-step solution for a thorough understanding of key concepts.

Step by stepSolved in 2 steps with 3 images

Knowledge Booster

Similar questions
- Test whether u, <µ2 at the a =0.05 level of significance for the sample data shown in the accompanying table. Assume that the populations are normally distributed. Click the icon to view the data table. Determine the null and alternative hypothesis for this test. O A. Ho:H1 = H2 Sample Data O B. Ho:H1arrow_forwardUsing the following table: 1. Determine a hypothesis to test the relationship between students enrolled 12 months or less and sleep of students, use descriptive statistics to describe the variables both numerically and graphically, identify the appropriate type of statistical test using alpha = 0.05, perform the statistical test (please show steps). ID Months enrolled Sleep 1 12 360 2 6 400 3 8 420 4 10 440 5 48 540 6 48 480 7 36 320 8 32 440 9 6 300 10 22 420 11 15 500 12 20 400 13 11 440 14 18 300 15 29 360 16 13 480 17 49 410 18 16 430 19 24 330 20 8 480arrow_forwardFiber Density. In the article “Comparison of Fiber Counting by TV Screen and Eyepieces of Phase Contrast Microscopy” (American Industrial Hygiene Association Journal, Vol. 63, pp. 756–761), I. Moa et al. reported on determining fiber density by two different methods. The fiber density of 10 samples with varying fiber density was obtained by using both an eyepiece method and a TV-screen method. A hypothesis test is to be performed to decide whether, on average, the eyepiece method gives a greater fiber density reading than the TV-screen method. a. identify the variable. b. identify the two populations. c. identify the pairs. d. identify the paired-difference variable. e. determine the null and alternative hypotheses. f. classify the hypothesis test as two tailed, left tailed, or right tailed.arrow_forward
- You wish to test the claim that u # 20 at a level of significance of a = 0.05 and are given sample statistics n 35, n = 35, x = 19.1, ands = 2.7. Compute the value of the %3D %3D %3D - %3D standardized test statistic using the formulaarrow_forwardYou wish to test the following claim (HaHa) at a significance level of α=0.01α=0.01. Ho:μ1=μ2Ho:μ1=μ2 Ha:μ1≠μ2Ha:μ1≠μ2You obtain the following two samples of data. Sample #1 Sample #2 65.8 77.7 105.1 78.6 89.2 69.1 96.7 91.3 105.9 87.5 70.5 93.9 83.4 88.3 79.5 66.7 83.4 91.7 106.7 73 75.7 98.7 76.7 80 53.2 92.1 93 78.2 72.4 79.1 82.1 74.1 78.2 85.5 85.9 99.3 84.2 104.3 88.3 107.6 63.8 99.8 97.7 86.3 74.9 72.7 77.5 93.9 76.1 77.1 81.9 74.1 73.6 78.7 81.9 78.9 81.1 88 85.8 75.3 74.3 77.5 69.1 75.5 72.9 80.1 84.3 73.1 67.3 72.2 76.1 67.8 74.9 67.3 74.7 70.1 65.4 76.9 83.8 79.7 72.9 81.7 74.1 68.2 65.4 80.9 69.4 79.5 96 77.5 77.1 75.9 68.7 What is the test statistic for this sample? (Report answer accurate to three decimal places.)test statistic = What is the p-value for this sample? For this calculation, use the degrees of freedom reported from the technology you are using. (Report answer accurate to four…arrow_forwardIn order to compare the life expectancies of three different brands of tires, 5 tires of each brand were randomly selected and were subjected to standard wear-testing procedures. Information regarding the three brands is shown below. Stone Bridge Michelle Nice Year Mean mileage (in 1000 miles) 42 46 41 Sample variance 3 2 5 Sample Size 5 5 5 Use the above data and test to see if the mean mileage for all three brands of tires is the same. Let α = .05. Complete the ANOVA table and show the details of calculation. a) State the null and alaternative hypotheses to be tested. b) Complete the table. The null hypothesis is to be tested at 95% confidence. You need to show all calculations. What do you conclude? Source of variation SS df MS F F critcal value Between Treatment SSTR= MSTR= Within Treatment SSE= MSE= Total SST=arrow_forward
- 1.3.2 Consider the output given below that was obtained using the One Proportion applet. Use information from the output to find the standardized statistic for a sample propor- tion value of 0.45. Probability of success (n): 0.30 Sample size (n): 25 Number of samples: 1000 O Animate Draw Samples Total = 1000 180 Mean = 0.301 SD = 0.091 120 60 0.08 0.16 0.24 0.32 0.40 0.48 0.56 0.64 Proportion of successarrow_forwardYou wish to test the following claim (HaHa) at a significance level of α=0.01α=0.01. Ho:μ1=μ2Ho:μ1=μ2 Ha:μ1<μ2Ha:μ1<μ2You obtain the following two samples of data. Sample #1 Sample #2 52 60.1 61.7 56.9 52 59.7 45 49.9 71.9 31.1 47.1 56.1 54.9 45 85.1 67 66.1 51.2 87.2 50.7 73.1 43.3 65.2 58.5 50.3 71.3 60.5 48 62.2 78.6 50.7 56.5 37.8 45.6 41.5 58.5 54.9 76.8 62.6 29.5 71.3 83.5 71.3 64.3 63 74.5 76.8 50.7 78.6 59.3 31.1 54.9 61.2 50.3 75.1 72.3 68.5 85.7 63.3 50.3 79.1 73.5 65.2 58.4 62.3 57 52.9 72.3 88.2 57.4 75.8 68.5 84.1 45 60 79.7 58.1 56.6 77.1 60.9 68.5 67.3 62 45 66.4 79.7 53.5 52.9 79.7 63.5 67.1 74.8 53.5 66.1 68.7 64.2 72.3 55.2 75.5 What is the test statistic for this sample? (Report answer accurate to three decimal places.)test statistic = What is the p-value for this sample? For this calculation, use the degrees of freedom reported from the technology you are using. (Report answer…arrow_forward10 11 12 13 14 15 16 Use a significance level of a=0.05 to test the claim that u = 19.6. The sample data consists of 10 scores for which x =20.1 and s=4.1. State the null and %3D alternative hypotheses, compute the value of the test statistic, and find the P-value for the sample. State your conclusions abcut the clalm. do H:H=19.6 H:Hz 19.6 O Test statistic: t=0.3856. P-Value: P=0.7087, Reject H. : u = 19.6. Since P>a, there is sufficient evidence to support the claim that the mean is different from 19.6. H :µ=20.1 H: Hz 20.1 O Test statistic: t= 20.1. P-Value: P=0.7087. Accept H: u = 20.1. Since P>a, there is not sufficient evidence to support the claim that the mean is different from 20.1. Ho: H= 19.6 H: uz 19.6 Submit Assignment Continue 2021 McGraw-Hill Education. All Rights Reserved. Terms of Use Privacy Accessibility DII & %24 7 t e farrow_forward
arrow_back_ios
arrow_forward_ios
Recommended textbooks for you
- MATLAB: An Introduction with ApplicationsStatisticsISBN:9781119256830Author:Amos GilatPublisher:John Wiley & Sons Inc
 Probability and Statistics for Engineering and th...StatisticsISBN:9781305251809Author:Jay L. DevorePublisher:Cengage Learning
 Statistics for The Behavioral Sciences (MindTap C...StatisticsISBN:9781305504912Author:Frederick J Gravetter, Larry B. WallnauPublisher:Cengage Learning
  Elementary Statistics: Picturing the World (7th E...StatisticsISBN:9780134683416Author:Ron Larson, Betsy FarberPublisher:PEARSON
 The Basic Practice of StatisticsStatisticsISBN:9781319042578Author:David S. Moore, William I. Notz, Michael A. FlignerPublisher:W. H. Freeman
 Introduction to the Practice of StatisticsStatisticsISBN:9781319013387Author:David S. Moore, George P. McCabe, Bruce A. CraigPublisher:W. H. Freeman
MATLAB: An Introduction with Applications
Statistics
ISBN:9781119256830
Author:Amos Gilat
Publisher:John Wiley & Sons Inc
Probability and Statistics for Engineering and th...
Statistics
ISBN:9781305251809
Author:Jay L. Devore
Publisher:Cengage Learning
Statistics for The Behavioral Sciences (MindTap C...
Statistics
ISBN:9781305504912
Author:Frederick J Gravetter, Larry B. Wallnau
Publisher:Cengage Learning
Elementary Statistics: Picturing the World (7th E...
Statistics
ISBN:9780134683416
Author:Ron Larson, Betsy Farber
Publisher:PEARSON
The Basic Practice of Statistics
Statistics
ISBN:9781319042578
Author:David S. Moore, William I. Notz, Michael A. Fligner
Publisher:W. H. Freeman
Introduction to the Practice of Statistics
Statistics
ISBN:9781319013387
Author:David S. Moore, George P. McCabe, Bruce A. Craig
Publisher:W. H. Freeman