
MATLAB: An Introduction with Applications
6th Edition
ISBN: 9781119256830
Author: Amos Gilat
Publisher: John Wiley & Sons Inc
expand_more
expand_more
format_list_bulleted
Related questions
Question
We wish to test of hypothesis
H0 : μ1 = μ2 = μ3
vs
H1 : Not all group
Use the significance level α = 0.01.
a. Find the value of the test statistic and its distribution.
b. Find the rejection region.
c. Find the p-value of the test.
d. Make a conclusion
all subparts please! thank you
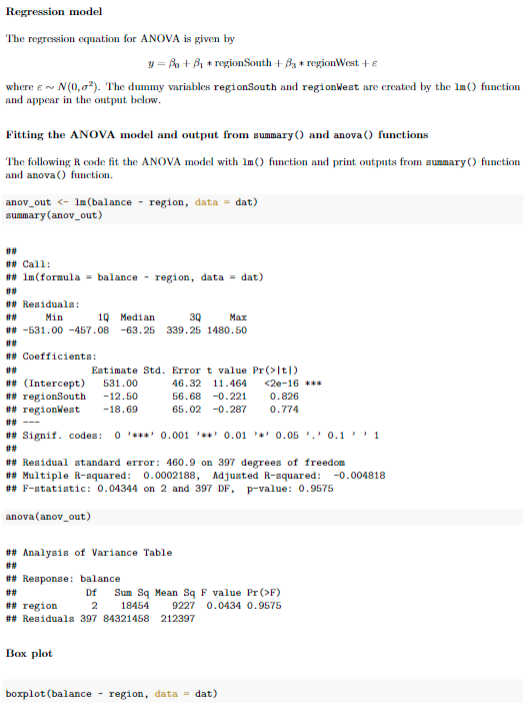

Transcribed Image Text:Regression model
The regression equation for ANOVA is given by
y = Bo + B₁ + region South + B + regionWest +
where ~ N(0,0²). The dummy variables regionSouth and regionWest are created by the 1m () function
and appear in the output below.
Fitting the ANOVA model and output from summary() and anova () functions
The following R code fit the ANOVA model with 1m () function and print outputs from summary() function
and anova () function.
anov_out <- lm (balance - region, data = dat)
summary (anov_out)
**
## Call:
## 1m (formula = balance - region, data = dat)
## Residuals:
Min
1Q Median
3Q
Max
## -531.00 -457.08 -63.25 339.25 1480.50
## Coefficients:
##
## (Intercept)
## regionSouth -12.50
## regionWest -18.69
Estimate Std. Error t value Pr(>1t|)
531.00
46.32 11.464 <2e-16 ***
56.68 -0.221
65.02 -0.287
## Signif. codes: 0*** 0.001 0.01 0.05 0.11
##
## Response: balance
##
## Residual standard error: 460.9 on 397 degrees of freedom
## Multiple R-squared: 0.0002188, Adjusted R-squared: -0.004818
## F-statistic: 0.04344 on 2 and 397 DF, p-value: 0.9575
anova (anov_out)
## Analysis of Variance Table
##
Box plot
0.826
0.774
Df
2
## region
## Residuals 397 84321458 212397
Sum Sq Mean Sq F value Pr(>F)
18454 9227 0.0434 0.9575
boxplot (balance - region, data = dat)

Transcribed Image Text:500 1000 1500 2000
balance
0
East
O
South
region
West
We wish to compare Balance in 3 different Region.
• Region: A factor with levels East, South, and West indicating the individual's geographical location.
Balance: Average credit card balance in $.
The mean balance for East, South and West are denoted, respectively, by 1, 2 and 3.
Data set
library (ISLR2)
head (Credit)
2 34
11 No
3 82
15 Yes
## Income Limit Rating Cards Age Education Own Student Married Region Balance
## 1 14.891 3606
## 2 106.025 6645
## 3 104.593 7075
## 4 148.924 9504
## 5 55.882 4897
## 6 80.180 8047
4 71
3 36
2 68
4 77
Yes South
Yes
West
No West
No West
Yes South
No South
283
483
514
681
357
569
balance <- Credit$Balance
region <as.factor (Credit$Region)
dat <- data.frame (region, balance)
str(dat)
##
region
## East 99
## South: 199
## West 102
##
##
##
11 No
11 Yes.
balance
:
Min.
1st Qu.:
Median
Mean
3rd Qu.: 863.00
0.00
68.75
459.50
: 520.01
Max. :1999.00
16 No
10 No
## 'data.frame':
400 obs. of 2 variables:
## $ region Factor w/ 3 levels "East", "South",..: 2 3 3 3 2 2 1 3 2 1 ...
## $ balance: num
333 903 580 964 331
summary (dat)
No
Yes
No
No
No
No
333
903
580
964
331
1151
Expert Solution
This question has been solved!
Explore an expertly crafted, step-by-step solution for a thorough understanding of key concepts.

Step by stepSolved in 3 steps with 5 images

Knowledge Booster

Similar questions
- Find test statistic and P value And state conclusion for the testarrow_forwardYou wish to test the following claim (Ha) at a significance level of a = 0.002. = Ho: P₁ Ha: P1 P2 P2 You obtain a sample from the first population with 594 successes and 78 failures. You obtain a sample from the second population with 558 successes and 44 failures. The test statistic is... O in the critical region not in the critical region critical value = test statistic = This test statistic leads to a decision to... reject the null hypothesis fail to reject the null hypothesis [three decimal accuracy] [three decimal accuracy] As such, the final conclusion is that... O There is sufficient evidence to support that the first population proportion is less than the second population proportion. There is not sufficient evidence to support that the first population proportion is less than the second population proportion.arrow_forwardq11arrow_forward
- You wish to test the following claim (HaHa) at a significance level of α=0.005. Ho:p=0.35 Ha:p≠0.35You obtain a sample of size n=650 in which there are 209 successful observations.Determine the test statistic formula for this test.What is the test statistic for this sample? (Report answer accurate to three decimal places.)test statistic = What is the p-value for this sample? (Report answer accurate to four decimal places.)p-value = The p-value is... less than (or equal to) αα greater than αα This test statistic leads to a decision to... reject the null accept the null fail to reject the null As such, the final conclusion is that... There is sufficient evidence to warrant rejection of the claim that the population proportion is not equal to 0.35. There is not sufficient evidence to warrant rejection of the claim that the population proportion is not equal to 0.35. The sample data support the claim that the population proportion is not equal to 0.35. There is not…arrow_forwardWhat are the degrees of freedom and critical values for independent samples t-tests with a = 0.05; two-tailed; n =10, n2= 10 %3D Please write your critical value answer in the following format: (for a 2 tailed test) 1.234 and-1.234 (for a one tailed test) 1.234 or -1.234arrow_forwardThe critical value in a hypothesis test Multiple Choice depends on the value of the test statistic. is calculated from the sample data. separates the acceptance and rejection regions. usually is .05 or .01 in most statistical tests.arrow_forward
- You are conducting a study to see if the proportion of women over 40 who regularly have mammograms is significantly more than 0.15. You use a significance level of a = 0.01. Но:р — 0.15 H1:p > 0.15 You obtain a sample of size n 137 in which there are 28 successes. What is the test statistic for this sample? (Report answer accurate to three decimal places.) test statistic = What is the p-value for this sample? (Report answer accurate to four decimal places.) p-value = The p-value is.. less than (or equal to) a greater than a This test statistic leads to a decision to... reject the null accept the null fail to reject the null As such, the final conclusion is that. O There is sufficient evidence to warrant rejection of the claim that the proportion of women over 40 who regularly have mammograms is more than 0.15. O There is not sufficient evidence to warrant rejection of the claim that the proportion of women over 40 who regularly have mammograms is more than 0.15. The sample data support…arrow_forwardPlease help me with this question.arrow_forwardYou wish to test the following daim (Ha) at a significance level of a = 0.05. Ho:P1 P2 You obtain a sample from the first population with 422 successes and 126 failures. You obtain a sample from the second population with 385 successes and 176 failures. critical value = [three decimal accuracy] test statistic = [three decimal accuracy]arrow_forward
arrow_back_ios
arrow_forward_ios
Recommended textbooks for you
- MATLAB: An Introduction with ApplicationsStatisticsISBN:9781119256830Author:Amos GilatPublisher:John Wiley & Sons Inc
 Probability and Statistics for Engineering and th...StatisticsISBN:9781305251809Author:Jay L. DevorePublisher:Cengage Learning
 Statistics for The Behavioral Sciences (MindTap C...StatisticsISBN:9781305504912Author:Frederick J Gravetter, Larry B. WallnauPublisher:Cengage Learning
  Elementary Statistics: Picturing the World (7th E...StatisticsISBN:9780134683416Author:Ron Larson, Betsy FarberPublisher:PEARSON
 The Basic Practice of StatisticsStatisticsISBN:9781319042578Author:David S. Moore, William I. Notz, Michael A. FlignerPublisher:W. H. Freeman
 Introduction to the Practice of StatisticsStatisticsISBN:9781319013387Author:David S. Moore, George P. McCabe, Bruce A. CraigPublisher:W. H. Freeman
MATLAB: An Introduction with Applications
Statistics
ISBN:9781119256830
Author:Amos Gilat
Publisher:John Wiley & Sons Inc
Probability and Statistics for Engineering and th...
Statistics
ISBN:9781305251809
Author:Jay L. Devore
Publisher:Cengage Learning
Statistics for The Behavioral Sciences (MindTap C...
Statistics
ISBN:9781305504912
Author:Frederick J Gravetter, Larry B. Wallnau
Publisher:Cengage Learning
Elementary Statistics: Picturing the World (7th E...
Statistics
ISBN:9780134683416
Author:Ron Larson, Betsy Farber
Publisher:PEARSON
The Basic Practice of Statistics
Statistics
ISBN:9781319042578
Author:David S. Moore, William I. Notz, Michael A. Fligner
Publisher:W. H. Freeman
Introduction to the Practice of Statistics
Statistics
ISBN:9781319013387
Author:David S. Moore, George P. McCabe, Bruce A. Craig
Publisher:W. H. Freeman