MATLAB: An Introduction with Applications
6th Edition
ISBN: 9781119256830
Author: Amos Gilat
Publisher: John Wiley & Sons Inc
expand_more
expand_more
format_list_bulleted
Question
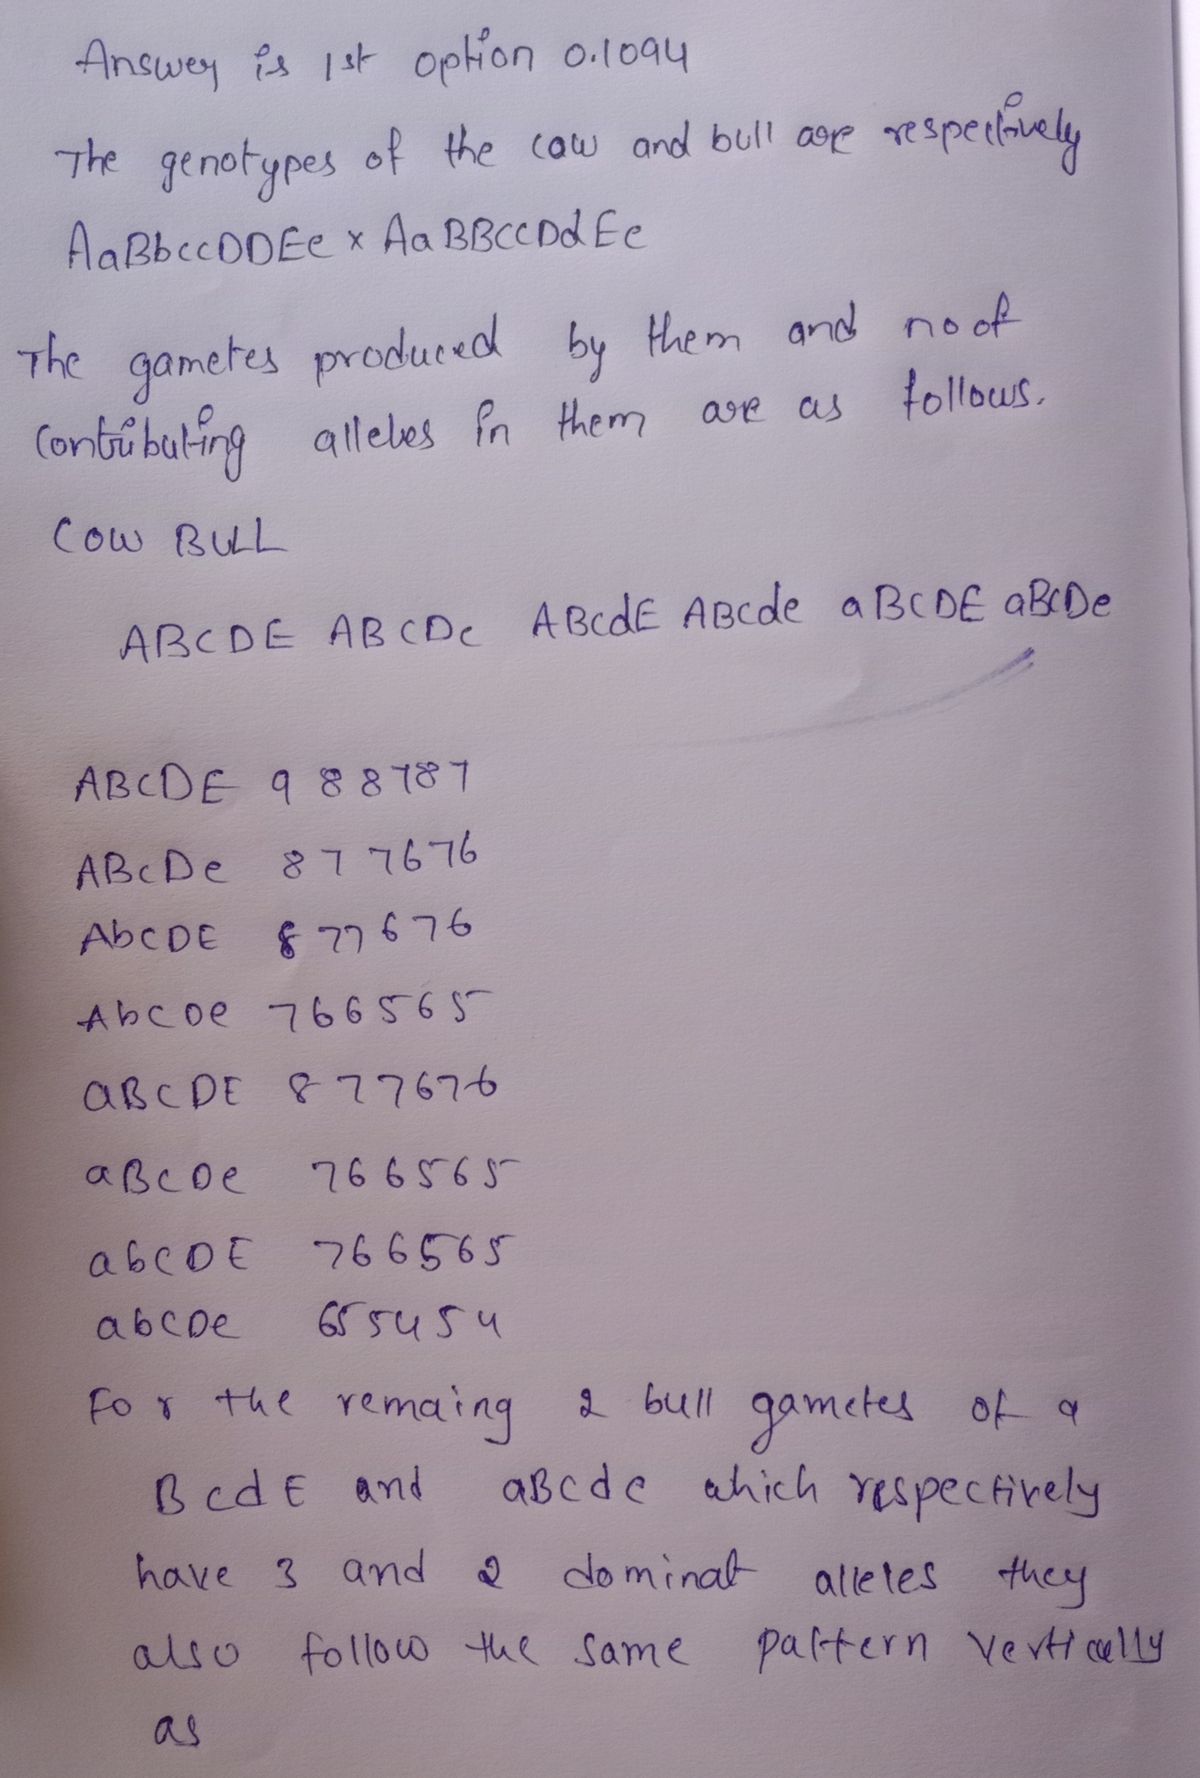
Five loci defined by microarrays are known to contribute to meat quality in cattle. These can be tested using microarrays. Premium meat quality occurs when eight or more of the alleles at these five loci are of the “contributing” variety. An uppercase letter indicates a contributing allele and lowercase letter indicates a noncontributing allele. One can determine the genotype of cattle with a microarray. If the following genotypes of a cow and a bull (respectively) are crossed, what is the probability the first offspring will have eight or more contributing alleles? Assume all loci are autosomal and independent.
AaBbccDDEe × AaBBCCDdEe
Expert Solution
arrow_forward
Step 1

Trending nowThis is a popular solution!
Step by stepSolved in 2 steps with 2 images

Knowledge Booster
Similar questions
- A Doctor is interested in the proportion of Lyon county residents who were infected with covid-19 virus. There were 425 covid-19 cases reported among 25474 residents in Lyon county a.What is the experimental unit in this experiment? b.What is the population in this experiment? c. What is a parameters considered in this experiment? d. What is a statistics in this experiment? e. What variables should pollster collect in this experiment?arrow_forwardHelp me find the sample size of a population of 500 using yamani formulararrow_forwardA biologist wants to determine if different temperatures (15oC, 25oC, or 35oC) and amounts of sunlight (partial or full) will affect the growth of plants. He will test each combination of temperature and sunlight by randomly assigning 15 plants to each of the combinations. What type of sampling is described in this study? one sample paired data two samples more than two samplesarrow_forward
- If SSBetween = 225.31 and there are four groups in the study with 10 cases per group, MSBetween = :arrow_forwardAccording to the National Health and Nutrition Examination Survey (NHANES) sponsored by the U.S. government, a random sample of 712 males between 20 and 29 years of age and a random sample of 1,001 males over the age of 75 were chosen and the weight of each of the males were recorded (in kg). Do the data provide evidence that the younger male population weighs more (on average) than the older male population? Use “Y” for ages 20-29 and “S” for ages 75+. It was found that x̅Y=83.4, sY=18.7, x̅S=78.5, and sS=19.0. a)Suppose the test statistic is t = 2.398. What is the associated p-value? Group of answer choices 0.001 < p-value < 0.002 0.005 < p-value < 0.01 0.01 < p-value < 0.02 0.0005 < p-value < 0.001 b) Suppose the p-value is 0.02 < p-value < 0.04. At α = 0.10 what is the appropriate conclusion to make? Group of answer choices Fail to reject H0 and conclude that the mean weight of all males ages 20-29 is greater than the mean weight of all…arrow_forwardQuestion 7 Consumer report uses a survey of readers to obtain customer satisfaction ratings for the nation's largest retailers. Each survey respondent is asked to rate a specified retailer in terms of six factor: quality of products, selection, value, check out efficiency, service and store layout . Any overall satisfaction score summarizes the rating for each respondent with 100 meaning the respondent is completely satisfied in terms of all six factors. Sample data respresentative of independeent samples of Target and Walmart customers are show below. Target Walmart n - 25 n = 30 mean = 79 mean = 71 part a Formulate the null and alternative hypoteses to test whether there is a difference between the population mean customer satisfactions scores for the two retailers part b Assume…arrow_forward
arrow_back_ios
arrow_forward_ios
Recommended textbooks for you
 MATLAB: An Introduction with ApplicationsStatisticsISBN:9781119256830Author:Amos GilatPublisher:John Wiley & Sons Inc
 Probability and Statistics for Engineering and th...StatisticsISBN:9781305251809Author:Jay L. DevorePublisher:Cengage Learning
 Statistics for The Behavioral Sciences (MindTap C...StatisticsISBN:9781305504912Author:Frederick J Gravetter, Larry B. WallnauPublisher:Cengage Learning
 Elementary Statistics: Picturing the World (7th E...StatisticsISBN:9780134683416Author:Ron Larson, Betsy FarberPublisher:PEARSON
 The Basic Practice of StatisticsStatisticsISBN:9781319042578Author:David S. Moore, William I. Notz, Michael A. FlignerPublisher:W. H. Freeman
 Introduction to the Practice of StatisticsStatisticsISBN:9781319013387Author:David S. Moore, George P. McCabe, Bruce A. CraigPublisher:W. H. Freeman

MATLAB: An Introduction with Applications
Statistics
ISBN:9781119256830
Author:Amos Gilat
Publisher:John Wiley & Sons Inc

Probability and Statistics for Engineering and th...
Statistics
ISBN:9781305251809
Author:Jay L. Devore
Publisher:Cengage Learning

Statistics for The Behavioral Sciences (MindTap C...
Statistics
ISBN:9781305504912
Author:Frederick J Gravetter, Larry B. Wallnau
Publisher:Cengage Learning

Elementary Statistics: Picturing the World (7th E...
Statistics
ISBN:9780134683416
Author:Ron Larson, Betsy Farber
Publisher:PEARSON

The Basic Practice of Statistics
Statistics
ISBN:9781319042578
Author:David S. Moore, William I. Notz, Michael A. Fligner
Publisher:W. H. Freeman

Introduction to the Practice of Statistics
Statistics
ISBN:9781319013387
Author:David S. Moore, George P. McCabe, Bruce A. Craig
Publisher:W. H. Freeman