MATLAB: An Introduction with Applications
6th Edition
ISBN: 9781119256830
Author: Amos Gilat
Publisher: John Wiley & Sons Inc
expand_more
expand_more
format_list_bulleted
Question

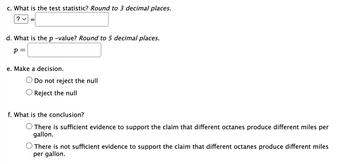
Transcribed Image Text:c. What is the test statistic? Round to 3 decimal places.
? ✓ =
d. What is the p-value? Round to 5 decimal places.
P =
e. Make a decision.
Do not reject the null
Reject the null
f. What is the conclusion?
There is sufficient evidence to support the claim that different octanes produce different miles per
gallon.
O There is not sufficient evidence to support the claim that different octanes produce different miles
per gallon.

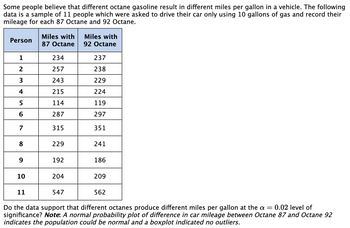
Transcribed Image Text:Some people believe that different octane gasoline result in different miles per gallon in a vehicle. The following
data is a sample of 11 people which were asked to drive their car only using 10 gallons of gas and record their
mileage for each 87 Octane and 92 Octane.
Person
1
2
3
4
5
6
7
8
9
10
11
Miles with
87 Octane
234
257
243
215
114
287
315
229
192
204
547
Miles with
92 Octane
237
238
229
224
119
297
351
241
186
209
562
Do the data support that different octanes produce different miles per gallon at the a = 0.02 level of
significance? Note: A normal probability plot of difference in car mileage between Octane 87 and Octane 92
indicates the population could be normal and a boxplot indicated no outliers.
Expert Solution
This question has been solved!
Explore an expertly crafted, step-by-step solution for a thorough understanding of key concepts.
Step by stepSolved in 2 steps with 2 images

Knowledge Booster
Similar questions
- Which of the following can increase error in a statistical experiment? (Select all that apply) a. Convenience Sample b. Small sample size c. The sample that has the same characteristics as the population. d. None of these condition will increase error in statistical experiments.arrow_forwardThe temperature reading from a thermocouple placed in a constant-temperature medium is normally distributed with mean μ, the actual temperature of the medium, and standard deviation o. USE SALT What would the value of o have to be to ensure that 95% of all readings are within 0.2° of μ? (Round your answer to four decimal places.) 0 = You may need to use the appropriate table in the Appendix of Tables to answer this question. Need Help? Read Itarrow_forwardI would like help in parts b-d please. Thank you!arrow_forward
- Part of an R output relating X (independent variable) and Y (dependent variable) is shown below. This analysis is based on 11 observations. Using what you know about how all of these values are related, fill in the remaining blanks. Round your answers to 4 decimals in Model Summary box. Round your answers to 2 decimals in the ANOVA table and beyond. Model Summary (4 decimal places each) R R-Squared Adj. R-Squared Pred. R-Squared Source Regression Residual Total ANOVA (2 decimal places each, where necessary) Sum of Squares X Model (Intercept) 0.3632 0.515 1000 RMSE Parameter Estimates (2 decimal places each) Beta Coef. Var. df 29.48 5.7871 Std. Error Std. Beta 0.699 Mean Square -0.72 t F Sig. 3.79 0.0043 -3.091 0.0129 Sig 0.0129arrow_forwardA researcher wants to know whether athletic women are more flexible than non - athletic women. For this experiment, a woman who exercised vigorously at least four times per week was considered "athletic". Flexibility is measured in inches on a sit & reach box. A researcher tested his claim using the following summary statistics: Athletic women Non-athletic women n = 50 * = 5.0 inches s=1.4 inches Assume that all conditions for testing have been met. t = 1.626; p = 0.057 ; At the 1% significance level, state your decision regarding the null hypothesis and your conclusion about the original claim. n = 30 * = 4.6 inches s= 0.8 inches O A. Fail to reject the null hypothesis; there is not strong enough evidence to suggest that athletic women are more flexible, on average, than non-athletic women. O B. Reject the null hypothesis; there is strong evidence to suggest that non-athletic women are more flexible, on average, than athletic women. OC. Fail to reject the null hypothesis; there is…arrow_forwardNeed the H0 and H1 values. Can use != for not equal to.arrow_forward
- A knewton.com Question The following data was calculated during a study on customer experience. Use the following information to find the test statistic and p-value at a 10% level of significance: • The claim is that the percent of companies that view customer experience as the most vital component of a growing business is different than 50%. Sample size = 50 companies • Sample proportion = 0.40 Use the table or the curve below to find the test statistic and p-value. For the curve select the appropriate test by dragging the blue point to a right-, left- or two-tailed diagram, then set the sliders. Use the purple slider to set the significance level. Use the black sliders to set the information from the study described above. z 0.00 0.01 0.02 0.03 0.04 0.05 0.06 0.07 0.08 0.09 |-1.5 0.067 0.0660.064 0.063 0.062 0.061 0.059 o.058 0.057 0.056 -1.40.081 0.0790.078 0.076 0.075 0.074 0.072 0.071 0.069 0.068 |-1.3 0.097 0.095 0.093 0.092 0.090 0.089 0.087 0.085 0.084 0.082 -1.2 0.115…arrow_forwardA physician wants to copmaure the blood pressures of six patients before and after treatment with a drug. The blood pressures are as follows: The physician wants to test if there is a significant change of the clood pressure before and after the drug at 0.05 level of significance. the absolute value of the test statistic and the absolute value of the test are, respectively: A. 0.7192 and 1.812 B. 0.7192 and 2.228 C. 1.6151 and 2.015 D. 1.6151 and 2.571arrow_forwardPlease solve for G, H, and I.arrow_forward
- For c is the null hypothesis rejected?arrow_forwardDetermine mu Subscript x overbar and sigma Subscript x overbar from the given parameters of the population and the sample size. Round the answer to the nearest thousandth where appropriate. mu equals34 , sigma equals10, nequals 17arrow_forwardNote: This is a question that was previously posted and answered, but due to policy only the first three was answered. I have posted the same question below, and have put which parts were answered, and which parts that I still need answered. Thank you. A. ( was answered) B.(was answered) The test statistic, t, =-1.74 C. (was answered)The P-value is 0.043 D. (was answered) State the conclusion for the test. Reject H0. or Fail to reject H0. E. Construct a confidence interval suitable for testing the claim that students taking nonproctored tests get a higher mean score than those taking proctored tests. ___<μ1−μ2<___ F. Does the confidence interval support the conclusion of the test? (Yes/ No) because the confidence interval contains (zero/ only positive value/ only negative values).arrow_forward
arrow_back_ios
SEE MORE QUESTIONS
arrow_forward_ios
Recommended textbooks for you
 MATLAB: An Introduction with ApplicationsStatisticsISBN:9781119256830Author:Amos GilatPublisher:John Wiley & Sons Inc
 Probability and Statistics for Engineering and th...StatisticsISBN:9781305251809Author:Jay L. DevorePublisher:Cengage Learning
 Statistics for The Behavioral Sciences (MindTap C...StatisticsISBN:9781305504912Author:Frederick J Gravetter, Larry B. WallnauPublisher:Cengage Learning
 Elementary Statistics: Picturing the World (7th E...StatisticsISBN:9780134683416Author:Ron Larson, Betsy FarberPublisher:PEARSON
 The Basic Practice of StatisticsStatisticsISBN:9781319042578Author:David S. Moore, William I. Notz, Michael A. FlignerPublisher:W. H. Freeman
 Introduction to the Practice of StatisticsStatisticsISBN:9781319013387Author:David S. Moore, George P. McCabe, Bruce A. CraigPublisher:W. H. Freeman

MATLAB: An Introduction with Applications
Statistics
ISBN:9781119256830
Author:Amos Gilat
Publisher:John Wiley & Sons Inc

Probability and Statistics for Engineering and th...
Statistics
ISBN:9781305251809
Author:Jay L. Devore
Publisher:Cengage Learning

Statistics for The Behavioral Sciences (MindTap C...
Statistics
ISBN:9781305504912
Author:Frederick J Gravetter, Larry B. Wallnau
Publisher:Cengage Learning

Elementary Statistics: Picturing the World (7th E...
Statistics
ISBN:9780134683416
Author:Ron Larson, Betsy Farber
Publisher:PEARSON

The Basic Practice of Statistics
Statistics
ISBN:9781319042578
Author:David S. Moore, William I. Notz, Michael A. Fligner
Publisher:W. H. Freeman

Introduction to the Practice of Statistics
Statistics
ISBN:9781319013387
Author:David S. Moore, George P. McCabe, Bruce A. Craig
Publisher:W. H. Freeman