
Cornerstones of Financial Accounting
4th Edition
ISBN: 9781337690881
Author: Jay Rich, Jeff Jones
Publisher: Cengage Learning
expand_more
expand_more
format_list_bulleted
Related questions
Question
Financial Accounting solve this problem
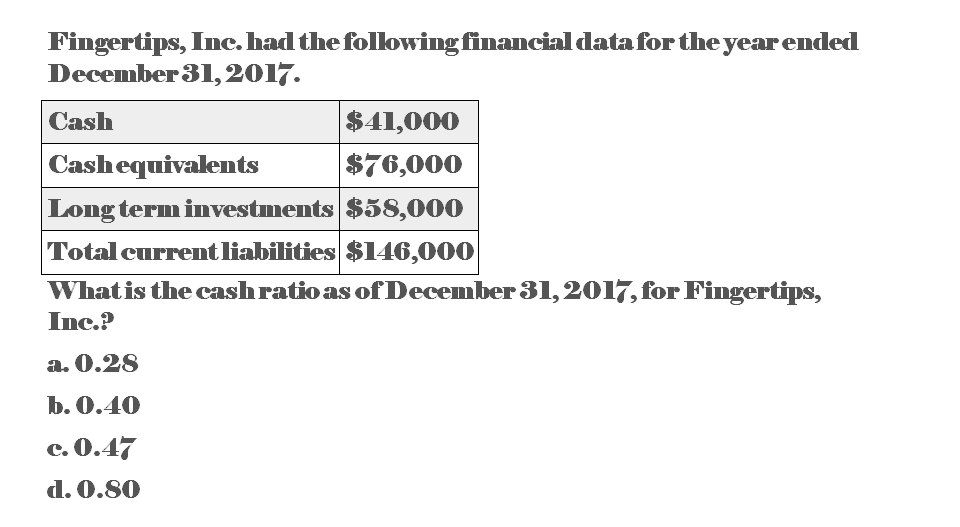

Transcribed Image Text:Fingertips, Inc. had the following financial data for the year ended
December 31, 2017.
Cash
Cash equivalents
$41,000
$76,000
Long term investments $58,000
Total current liabilities $146,000
What is the cash ratio as of December 31, 2017, for Fingertips,
Inc.?
a. 0.28
b. 0.40
c. 0.47
d. 0.80
Expert Solution
This question has been solved!
Explore an expertly crafted, step-by-step solution for a thorough understanding of key concepts.

Step by stepSolved in 2 steps

Knowledge Booster

Similar questions
- Given the data in the following table, the entry for Inventories on the 2023 common-sized balance sheet was %.arrow_forwardPhillips, Inc. had the following financial data for the year ended December 31, 2025. Cash $42,000 Cash equivalents 78,000 Long term investments 58,000 Total current liabilities 150,000 What is the cash ratio as of December 31, 2025, for Phillips, Inc.? (Round your answer to two decimal places.) A. 0.80 B. 0.46 C. 0.28 D. 0.39arrow_forwardGiven the data in the following table, accounts receivable in 2023 was…arrow_forward
- Suppose the following financial data were reported by 3M Company for 2021 and 2022 (dollars in millions). Current assets 3M Company Balance Sheets (partial) Cash and cash equivalents Accounts receivable, net Inventories Other current assets Total current assets Current liabilities Screenshot Current ratio Working capital 2022 $ $3,180 3,600 2,738 1,932 $11,450 $4,830 2021 $1,836 3,180 3,019 1,590 Suppose that at the end of 2022, 3M management used $183 million cash to pay off $183 million of accounts payable. How would its current ratio and working capital have changed? (Round current ratio to 2 decimal places, e.g. 1.25: 1. Enter working capital answer to million.) $9,625 $5,887 :1 million Donearrow_forwardConsider the following financial data for Nguyen Industries: Statement of Financial Position as of December 31, 2018 Cash $ 232,500 Accounts payable $ 86,500 Accts. receivable 357,500 Short-term bank note 254,000 Inventories 150,500 Accrued wages & taxes 80,000 Total current assets $ 740,500 Total current liabilities $ 420,500 Long-term debt 566,000 Net fixed assets 774,500 Common equity 528,500 Total assets $ 1,515,000 Total liab. & equity $ 1,515,000 Profit & Loss Statement for 2018 Industry Average Ratios Net sales $ 1,894,000 Current ratio 1.4× Cost of goods sold 1,382,500 Quick ratio 1.0× Gross profit $ 511,500 Days sales outstanding 63 days Operating expenses 373,000 Inventory turnover 9.5× EBIT $ 138,500 Total asset turnover 1.5× Interest expense 64,000 Net…arrow_forwardPlease show calculationarrow_forward
- Suppose the following financial data were reported by 3M Company for 2021 and 2022 (dollars in millions). 3M Company Balance Sheets (partial) Current assets Cash and cash equivalents Accounts receivable, net Inventories Other current assets Total current assets Current liabilities 2022 $3,010 3,510 2,765 1,914 2021 $4,770 $1,908 3,195 3,028 1,621 $11,199 $9,752 $5,800arrow_forwardGiven the data in the following table, the Net Profit Margin in 2023 was… % (table is attached) 1) 12.74 2 ) 16.73 3) 15.49 4) 11.69 5) 10.62arrow_forwardBelow are Laiho Industries’ 2017 and 2018 balance sheet items: 2018 2017 Cash $ 102,850.00 $ 89,725.00 Accounts Receivable $ 103,365.00 $ 85,527.00 Long-Term Debt $ 76,264.00 $ 63,914.00 Accounts Payable $ 30,761.00 $ 23,109.00 Common Stock (total value) $ 100,000.00 $ 90,000.00 Notes Payable $ 16,717.00 $ 14,217.00 Net Fixed Assets $ 67,165.00 $ 42,436.00 Accruals $ 30,477.00 $ 22,656.00 Inventories $ 38,444.00 $ 34,982.00 Retained Earnings $ 57,605.00 $ 38,774.00 Sales for 2018 were $455,150, and EBITDA was 15% of sales. Furthermore, depreciation and amortization were 11% of net fixed assets, interest was $8,575, the corporate tax rate was 40%, and Laiho pays 40% of its net income as dividends. Given this information, construct the firm’s 2018…arrow_forward
- M7Q1 Redoarrow_forwardhas the following balance sheet (December 31, 2023). The figures are in $ million. Cash Short-term investments Accounts receivable Inventory Current assets Gross fixed assets Accumulated deprec. Net fixed assets $40 30 30 70 170 250 50 200 Total assets Accounts payable Accruals Notes payable $370 Current liabilities Long-term debt Common stock (par value=$1) Retained earnings Total common equity Total liab. & equity Note that only 50% of "cash" (shown in the balance sheet above) is used in operation. $30 50 10 90 70 30 180 210 Use the above information to answer questions 8 8. What is its total operating capital for 2023? $240 m $370arrow_forwardcompute the cash ratios for 2018 and 2017 (Round your answers to two decimal places, X.XX.) 2018:? 2017:? here is the data table Ranfield, Inc. Comparative Balance Sheet December 31, 2018 and 2017 2018 2017 2016* Assets Current Assets: Cash $91,000 $90,000 Accounts Receivables, Net 112,000 119,000 $102,000 Merchandise Inventory 148,000 160,000 202,000 Prepaid Expenses 17,000 6,000 Total Current Assets 368,000 375,000 Property, Plant, and Equipment, Net 213,000 174,000 Total Assets $581,000 $549,000 $596,000 Liabilities Total Current Liabilities $223,000 $241,000 Long-term Liabilities 115,000 98,000 Total Liabilities 338,000 339,000 Stockholders' Equity…arrow_forward
arrow_back_ios
SEE MORE QUESTIONS
arrow_forward_ios
Recommended textbooks for you
- Cornerstones of Financial AccountingAccountingISBN:9781337690881Author:Jay Rich, Jeff JonesPublisher:Cengage Learning
Cornerstones of Financial Accounting
Accounting
ISBN:9781337690881
Author:Jay Rich, Jeff Jones
Publisher:Cengage Learning