
MATLAB: An Introduction with Applications
6th Edition
ISBN: 9781119256830
Author: Amos Gilat
Publisher: John Wiley & Sons Inc
expand_more
expand_more
format_list_bulleted
Related questions
Topic Video
Question

Transcribed Image Text:10, n 5
Hew the t-dist
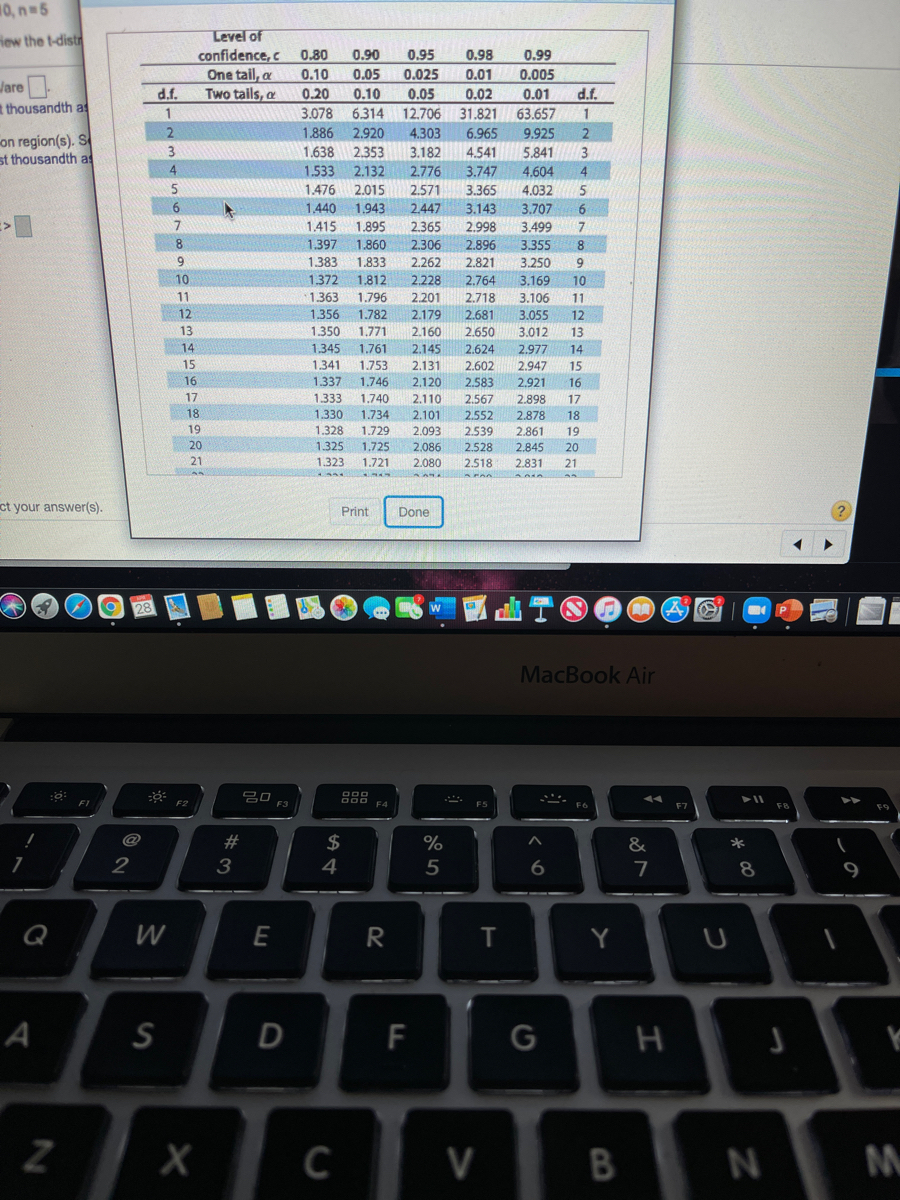
Level of
confidence, c
One tail, a
Two talls, a
0.80
0.90
0,95
0.98
0.99
0.10
0.05
0.025
0.01
0.005
Jare
t thousandth as
d.f.
0.20
0.10
0.05
0.02
0.01
d.f.
1
3.078
6314 12,706
31.821 63.657
1
1,886
2.920
4.303
6.965
9.925
on region(s). S
st thousandth as
3
1,638
2.353
3.182
4.541
5.841
3
4.
1.533
2.132
2.776
3.747
4.604
4.
1.476
2.015
2.571
3.365
4.032
5
1.440
1.943
2.447
3.143
3.707
6.
7
1,415
1.895
2.365
2.998
3.499
1.397
1.860
2.306
2.896
3.355
8.
1.383
1.372
1.363
1.356
1.833
1,812
9.
2.262
2.821
3.250
9
10
2.228
2.764
3.169
10
11
1,796
2,201
2.718
3.106
11
12
1.782
2.179
2.681
3.055
12
13
1.350
1.771
2,160
2.650
3.012
13
14
1.345
1.761
2.145
2.624
2.977
14
15
1.341
1.753
2.131
2.602
2.947
15
16
1.746
1.740
1.734
1.337
2,120
2.583
2.921
16
17
1.333
2.110
2.567
2.898
17
2.552
2.539
18
1.330
2.101
2.878
18
19
1.328
1.729
2.093
2.861
19
20
1.325
1.725
2.086
2.528
2.845
20
21
1.323
1.721
2.83
21
ct your answer(s).
Print
Done
MacBook Air
20 F3
FI
F2
F4
F7
F8
@
23
%
&
*
3
4
6.
7
Q
E
R
Y
S
F
C
V

Transcribed Image Text:Find the critical value(s) and rejection region(s) for the indicated t-test, level of significance a, and sample size n.
Right-tailed test, a= 0.10, n 5
= Click the icon to view the t-distribution table.
The critical value(s) is/are .
(Round to the nearest thousandth as needed. Use a comma to separate answers as needed.)
Determine the rejection region(s). Select the correct choice below and fill in the answer box(es) within your choice.
(Round to the nearest thousandth as needed.)
O A.
<t<
O B. t<
O C. t<
and t>
O D. t>
Click to select your answer(s).
28
Expert Solution
This question has been solved!
Explore an expertly crafted, step-by-step solution for a thorough understanding of key concepts.

Step by stepSolved in 2 steps with 1 images

Knowledge Booster


Learn more about
Need a deep-dive on the concept behind this application? Look no further. Learn more about this topic, statistics and related others by exploring similar questions and additional content below.Similar questions
- Use the standard normal table to find the z-score that corresponds to the given percentile. If the area is not in the table, use the entry closest to the area. If the area is halfway bet two entries, use the -score halfway between the corresponding z-scores. If convenient, use technology to find the z-score. P7arrow_forwardYou are the operations manager for an airline and you are considering a higher fare level for passengers in aisle seats. How many randomly selected air passengers must you survey? Assume that you want to be 95% confident that the sample percentage is within 5.5 percentage points of the true population percentage. Complete parts (a) and (b) below. Lab Statistic ly Courses a. Assume that nothing is known about the percentage of passengers who prefer aisle seats. ourse Home n = nnouncements (Round up to the nearest integer.) ssignments b. Assume that a prior survey suggests that about 36% of air passengers prefer an aisle seat. n = Etudy Plan (Round up to the nearest integer.) 1 of 1 Gradebook StatCrunch 1 of 1 eText 1 of oo Chapter Contents Tools for Success 0 of 1 Multimedia Library Purchase Options 1 of 2 Enter your answer in each of the answer boxes. Course Tools Discussions d山T0E NOV 5. PADES 28 1405 3D W MacBook Air 80 000 000 F1 F2 F3 F4 F5 DII F6 DD F7 F8 #3 F9 $ F10 2 & 4 %24 3.arrow_forwardThe purpose and intent of the assignment is to help you better understand the sampling distribution of the mean. The class sampling exercise In class we conducted a sampling exercise. The population consisted of 25 elements. The possible values for the elements in the population ranged from 1 to 9 and were distributed as follows: Value Frequency Proportion Percentage 1 1 0.04 4% 2 2 0.08 8% 3 3 0.12 12% 4 4 0.16 16% 5 5 0.2 20% 6 4 0.16 16% 7 3 0.12 12% 8 2 0.08 8% 9 1 0.04 4% As in the class exercise, 10 elements are drawn replacing each element before the next is drawn. This was done 1000 times. The data set is given in a separate…arrow_forward
- Weights (kg) of poplar trees were obtained from trees planted in a rich and moist region. The trees were given different treatments identified in the accompanying table. Use a 0.05 significance level to test the claim that the four treatment categories yield poplar trees with the same mean weight. Is there a treatment that appears to be most effective? LOADING... Click the icon to view the data table of the poplar weights. No Treatment Fertilizer Irrigation Fertilizer and Irrigation 1.24 0.99 0.09 0.93 0.65 0.94 0.63 1.41 0.41 0.55 0.13 1.06 0.15 0.51 0.88 1.49 1.31 1.01 0.84 Determine the null and alternative hypotheses. H0: ▼ mu 1 greater than mu 2 greater than mu 3 greater than mu 4μ1>μ2>μ3>μ4 Exactly two of the population means are equal.Exactly two of the population means are equal. Not all of the population means are equal.Not all of the population means…arrow_forwardDescribe the sampling distribution of p. Round to three decimal places when necessary. N=22,000, n=400, p=0.3arrow_forwardStatistics students believe that the mean score on a first statistics test is 65. The instructor thinks that the mean score is higher. She samples 10 statistics students and obtains the scores: Grades 73.5 63.9 64.3 85.5 62.7 69 88 63.9 65 64.3 Test grades are believed to be normally distributed.Use a significance level of 5%.arrow_forward
- Does Hypnotism Relieve Pain? The table shows the pain levels of patients before and after hypnotism. Pain level is measured on a cm scale. Assume that the two samples are randomly selected. At the 0.05 significance level, test the claim that the mean difference has increased after hypnotism.(Be sure to subtract in the same direction).arrow_forwardPlease answer quickly!arrow_forwardNeed crit value, the pictured question b, and rejection region.arrow_forward
- Determine the type of sampling used in the following scenario. A student wants to know the average height of the class. The student asks 3 male classmates and 3 female classmates for their height. simple random sampling stratified sampling cluster sampling systematic sampling convenience samplingarrow_forwardData Management - Organization of Data for analysisarrow_forwardDon't hand writing solution.arrow_forward
arrow_back_ios
SEE MORE QUESTIONS
arrow_forward_ios
Recommended textbooks for you
- MATLAB: An Introduction with ApplicationsStatisticsISBN:9781119256830Author:Amos GilatPublisher:John Wiley & Sons Inc
 Probability and Statistics for Engineering and th...StatisticsISBN:9781305251809Author:Jay L. DevorePublisher:Cengage Learning
 Statistics for The Behavioral Sciences (MindTap C...StatisticsISBN:9781305504912Author:Frederick J Gravetter, Larry B. WallnauPublisher:Cengage Learning
  Elementary Statistics: Picturing the World (7th E...StatisticsISBN:9780134683416Author:Ron Larson, Betsy FarberPublisher:PEARSON
 The Basic Practice of StatisticsStatisticsISBN:9781319042578Author:David S. Moore, William I. Notz, Michael A. FlignerPublisher:W. H. Freeman
 Introduction to the Practice of StatisticsStatisticsISBN:9781319013387Author:David S. Moore, George P. McCabe, Bruce A. CraigPublisher:W. H. Freeman
MATLAB: An Introduction with Applications
Statistics
ISBN:9781119256830
Author:Amos Gilat
Publisher:John Wiley & Sons Inc
Probability and Statistics for Engineering and th...
Statistics
ISBN:9781305251809
Author:Jay L. Devore
Publisher:Cengage Learning
Statistics for The Behavioral Sciences (MindTap C...
Statistics
ISBN:9781305504912
Author:Frederick J Gravetter, Larry B. Wallnau
Publisher:Cengage Learning
Elementary Statistics: Picturing the World (7th E...
Statistics
ISBN:9780134683416
Author:Ron Larson, Betsy Farber
Publisher:PEARSON
The Basic Practice of Statistics
Statistics
ISBN:9781319042578
Author:David S. Moore, William I. Notz, Michael A. Fligner
Publisher:W. H. Freeman
Introduction to the Practice of Statistics
Statistics
ISBN:9781319013387
Author:David S. Moore, George P. McCabe, Bruce A. Craig
Publisher:W. H. Freeman