
Related questions
The purpose and intent of the assignment is to help you better understand the sampling distribution of
the
The class sampling exercise
In class we conducted a sampling exercise.
The population consisted of 25 elements.
The possible values for the elements in the population
follows:
Value Frequency Proportion Percentage
1 1 0.04 4%
2 2 0.08 8%
3 3 0.12 12%
4 4 0.16 16%
5 5 0.2 20%
6 4 0.16 16%
7 3 0.12 12%
8 2 0.08 8%
9 1 0.04 4%
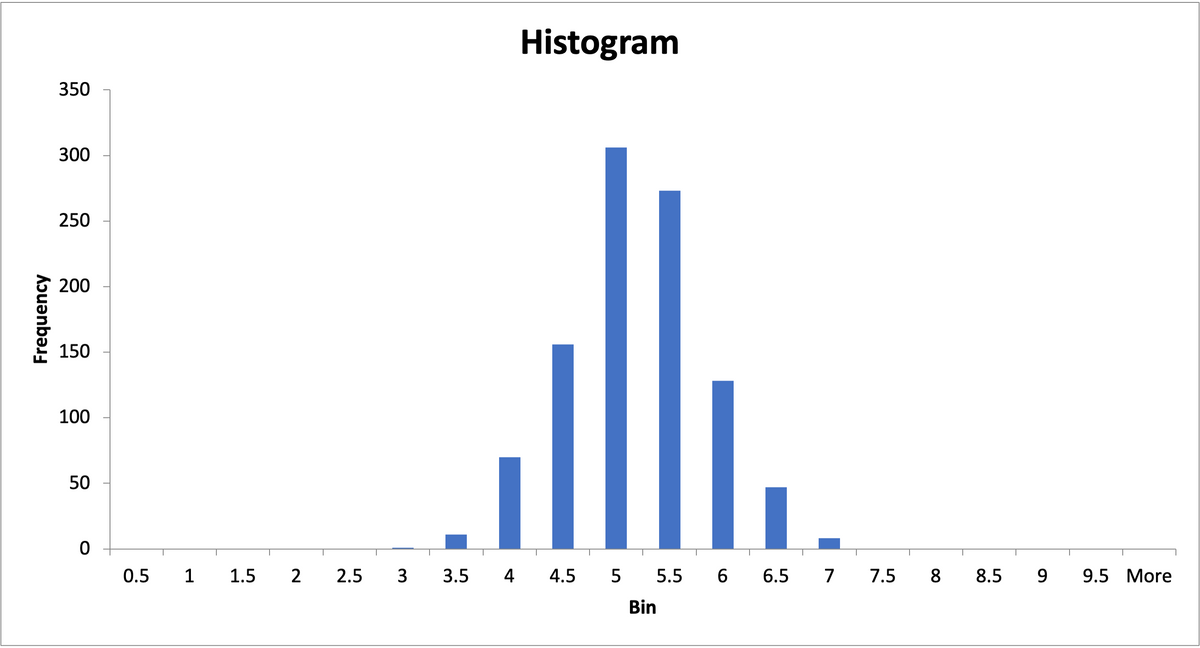
As in the class exercise, 10 elements are drawn replacing each element before the next is drawn.
This was done 1000 times.
The data set is given in a separate spreadsheet and consists of the numbers drawn for these 1000 draws
in the order in which these were drawn. Each line can be considered a
With all calculations, include the formula that you used.
Using Excel, compute the mean and standard deviation for each of the samples. Each sample will
have a mean and a standard deviation.
18. What, theoretically, would be the highest sample standard deviation that could ever be
observed?
19. What was the highest sample standard deviation actually observed?
20. What, theoretically, would be the smallest sample standard deviation that could ever be
observed?
21. What was the smallest sample standard deviation actually observed?


Step by stepSolved in 3 steps with 2 images


- The purpose and intent of the assignment is to help you better understand the sampling distribution of the mean. The class sampling exercise In class we conducted a sampling exercise. The population consisted of 25 elements. The possible values for the elements in the population ranged from 1 to 9 and were distributed as follows: Value Frequency Proportion Percentage 1 1 0.04 4% 2 2 0.08 8% 3 3 0.12 12% 4 4 0.16 16% 5 5 0.2 20% 6 4 0.16 16% 7 3 0.12 12% 8 2 0.08 8% 9 1 0.04 4% As in the class exercise, 10 elements are drawn replacing each element before the next is drawn. This was done 1000 times. The data set is given in a separate…arrow_forwardCans of soda vary slightly in weight. Given below are the measured weights of seven cans, in pounds. Find the mean and median of these weights. Which, if any, of these weights would be considered an outlier? What are the mean and median weights if the outlier is excluded? 0.8161 0.8193 0.8164 0.8177 0.7913 0.8144 0.8126 Find the mean and median of the weights? The median? Which, if any, of these weights would be considered an outlier? Select the correct choice below and, if necessary, fill in the answer box to complete your choice? Find the mean with the outlier excluded. Select the correct choice below and, if necessary, fill in the answer box to complete your choice? Find the median with the outlier excluded. Select the correct choice below and, if necessary, fill in the answer box to complete your choice? Please explain step by step?. .arrow_forwardLet's examine the mean of the numbers 1, 2, 3, 4, 5, 6, 7, and 8 by drawing samples from these values, calculating the mean of each sample, and then considering the sampling distribution of the mean. To do this, suppose you perform an experiment in which you roll an eight-sided die two times (or equivalently, roll two eight-sided dice one time) and calculate the mean of your sample. Remember that your population is the numbers 1, 2, 3, 4, 5, 6, 7, and 8. The true mean (µ) of the numbers 1, 2, 3, 4, 5, 6, 7, and 8 is , and the true standard deviation (o) is The number of possible different samples (each of size n = 2) is the number of possibilities on the first roll (8) times the number of possibilities on the second roll (also 8), or 8(8) = 64. If you collected all of these possible samples, the mean of your sampling distribution of means (µM) would equal and the standard deviation of your sampling distribution of means (that is, the standard error or ɑm) would be The following chart…arrow_forward
- A Likert Scale is a tool used in many sample surveys to collect opinions on a statement. In this exercise you are asked to use a scale that runs from 5=strongly agree 4-agree 3-neither agree nor disagree 2-disagree 1-strongly disagree What sort of data is a Likert Scale, and why?arrow_forwardDetermine whether the sampling is dependent or independent. Indicate whether the response variable is qualitative or quantitative.A psychologist wants to measure the effect of music on memory. He randomly selects 80 students and measures their scores on a memory test conducted in silence. The next day he measures their scores on a similar test conducted while classical music is playing. The mean score without music is compared to the mean score with music. Group of answer choices a.quantitative, dependent b.qualitative, independent c.qualitative, dependent d.quantitative, independentarrow_forwardDescriptive Measures Instructions: Use the following data set to find the sample statistics for the following data set. (Round answers to the nearest hundredth, if necessary). {51, 48, 42, 43, 48, 48, 46, 15, 29, 45, 47, 55, 46, 35, 47, 48, 54, 26, 53, 42} 1. Five number summary: (List the numbers in ascending order, separated with a comma and a space. Example: 1, 2, 3, 4, 5.) 2. IQR = 3. Outliers for this data set would be less than or more than 4. How many outliers are there? 5. What is the shape of the distribution? 6. Which is a better measure of variation; interquartile range or standard deviation IQR standard deviation Next pagearrow_forward
- you are student in a statistics class that uses weighted mean to calculate your course grade.the weights for each category are as follows: 25%-HOMEWORK 15%-ACTIVITIES 35%-EXAMS 25%-FINAL EXAM you haven't taken the exam yet but you have averages for all other grades in the class.they are as follows 92%-HOMEWORK 84%-ACTIVITES 86%-EXAMS what is your weighted grade before you take the finalarrow_forwardFind the estimated standard error for the sample mean for n = 13 and SS = 3639. Nearest hundredths place.arrow_forwardIndicate the statistical test you would conduct. Respondents in a survey of 1,000 households were asked about their travel history. Specifically, they were asked how often they have been to Europe in the past five years (using a ratio scale). People were also classified by interest type (art-lovers, food-lovers, or sports-lovers). The question is whether interest type influences travel history. Two-sample t-test Paired sample t-test One-way ANOVA none of those QUESTION 6 What is the corresponing alternative hypothesis for the scenario in question #5? The three interest types do not differ with regard to the number of times they have been to Europe in the last five years. Interest type and travel to Europe are not related. The number of times people have been to Europe does not depend on interest type. The three interest types differ with regard to the number of times they have been to Europe in the last five years.arrow_forward
- MATLAB: An Introduction with ApplicationsStatisticsISBN:9781119256830Author:Amos GilatPublisher:John Wiley & Sons Inc
 Probability and Statistics for Engineering and th...StatisticsISBN:9781305251809Author:Jay L. DevorePublisher:Cengage Learning
 Statistics for The Behavioral Sciences (MindTap C...StatisticsISBN:9781305504912Author:Frederick J Gravetter, Larry B. WallnauPublisher:Cengage Learning
  Elementary Statistics: Picturing the World (7th E...StatisticsISBN:9780134683416Author:Ron Larson, Betsy FarberPublisher:PEARSON
 The Basic Practice of StatisticsStatisticsISBN:9781319042578Author:David S. Moore, William I. Notz, Michael A. FlignerPublisher:W. H. Freeman
 Introduction to the Practice of StatisticsStatisticsISBN:9781319013387Author:David S. Moore, George P. McCabe, Bruce A. CraigPublisher:W. H. Freeman