
MATLAB: An Introduction with Applications
6th Edition
ISBN: 9781119256830
Author: Amos Gilat
Publisher: John Wiley & Sons Inc
expand_more
expand_more
format_list_bulleted
Related questions
Concept explainers
Question
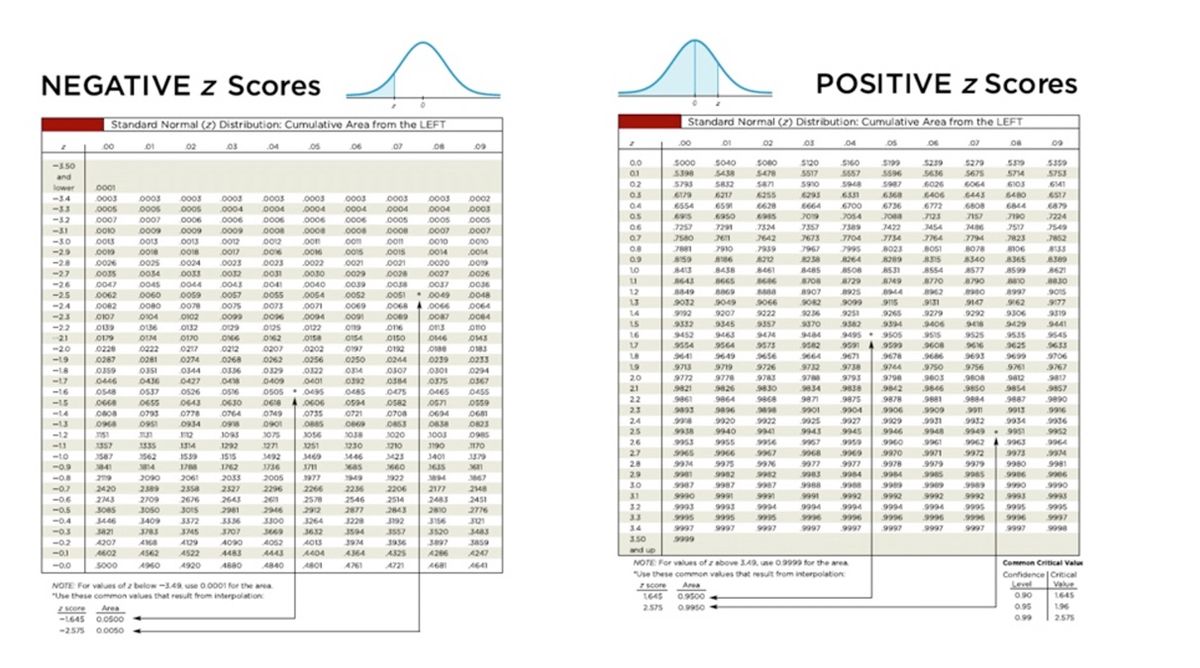

Transcribed Image Text:NEGATIVE z Scores
POSITIVE z
z Scores
Standard Normal (2) Distribution: Cumulative Area from the LEFT
| Standard Normal (2) Distribution: Cumulative Area from the LEFT
00
01
02
00
01
02
03
04
0s
06
09
03
04
0s
06
07
08
-350
0.0
so00
5040
s120
S239
$279
S517
5596
5636
STA
5398
5785
SAS8
S478
S557
5675
S753
and
02
Sa2
5910
5948
6026
6064
603
6141
lower
0001
03
79
6217
6255
6293
6331
6368
6406
6480
6517
0003
000s
0003
000s
0004
-34
0003
0003
0003
000s
o00s
0003
o002
04
6554
659
64
6700
6736
6772
723
-33
00os
.0004
0004
0004
o004
0004
6808
6844
879
695
.7257
as
6950
7019
J054
7190
7224
-32
0007
0007
0006
0006
000s
0006
0006
000s
00os
ocos
--31
0009
0009
0009
0008
0008
0008
c008
0007
0007
7291
7324
7357
7389
7422
3454
3486
7517
7549
oom
07
7580
7642
7673
7704
7754
7764
7794
7823
7852
--30
-29
o012
p02
0on
.0016
con
O010
8023
8289
8531
O018
o017
D06
0014
7881
7910
7959
7967
7995
BOSI
BO78
859
86
8238
8264
8315
8340
8365
8389
0025
0034
-28
0026
0024
0023
0023
0022
0021
.0020
8438
8485
ASOR
8S08
8554
AS77
A599
8621
-27
0032
0030
0040
0033
0029
0028
0027
0026
643
8665
8729
8749
8770
8790
8830
-26
0047
0045
0044
0043
0041
0039
0037
8888
8997
9162
12
B849
8907
8925
9015
-25
0062
0060
0057
0oss
o054
0052
0051. 0049
0048
9012
9049
SOR2
9099
9251
9147
977
-24
0082
0080
0078
0075
0073
.0071
o094
0069
0064
14
9207
9222
9236
9279
9292
9306
9519
9441
9265
-23
0104
009
0087
9332
9345
9370
9394
9495. 95os
951 4 95
9671
9382
3406
9515
-22
0136
O132
0129
0125
0122
ons
ono
9357
9416
9429
16
9525
9452
9554
21
0134
0170
015a
0150
OM6
9463
9474
9484
9535
9545
9573
9656
17
9564
9582
9608
9625
9633
0222
0281
-20
0226
0217
0212
0207
0202
0256
9649
9719
-19
0287
0274
0268
0262
0250
0244
0239
0233
941
664
9676
9686
9699
19
9713
9726
9732
9738
9744
9750
9756
9761
9767
-18
-17
0344
0329
0307
0294
9803
9612
9854
20
9776
9783
9788
9793
9798
9808
9817
0436
OS37
.0655
0793
0446
0427
04
0409
0401
0392
0384
0375
0367
9830
9857
9890
Osos. 049s
0455
21
9821
9826
9834
9838
9842
3846
9850
-16
0548
Os26
OS16
0485
0475
0465
-15
0643
0594
22
9861 9864 9868
9871
9875
9878
981
9884 9887
0630
0764
os82
os59
23
9893
9896
01
9904
9906
9909
9931
-14
0778
0735
0708
9013
9916
0749
0721
0694
24
9920
9922
025
9927
9932
9934
0638
1003
-13
0968
095
0934
098
0901
0885
0869
0853
O823
9949 . 951
9962 9963
9972
9979
9985
9989
-12
3075
3038
25
9938
9940
9941
9943
9945
9946
9948
9952
3020
3210
0985
J170
9959
9960
9970
26
9953
9955
9956
9961
9964
1357
3587
1335
1314
1292
1271
3251
1230
3190
27
9971
973
9934
-to
3562
1539
1515
3492
M69
3446
3423
3401
28
9974
9975
9977
9977
9978
9979
9980
9981
-0.9
3014
178
1762
1736
371
3660
9985
9989
-0.8
2090
2061
2033
2005
2977
1949
3922
3894
3867
29
9984
9984
9906
9968
9992
-07
2420
2589
2327
2296
2266
2206
2177
2148
3.0
9987
9987
9988
9989
9990
9990
2358
2256
31
9990
9991
9991
9991
9992
9992
9992
9993
9933
261
2514
2483
2810
-0.6
2M3
2709
2676
2643
2578
2546
2451
9994
9996
32
9993
9995
9993
9995
9994
9994
9994
9994
9995
9995
9996
-0.5
3085
3050
3015
3372
2981
2946
292
2877
2843
2776
33
9996
9996
9996
3300
3264
J192
3557
3936
-0.4
3409
3336
3228
3156
34
9997
9997
9997
9997
9997
9997
9997
9997
9998
3594
3974
-03
3821
3783
3707
3632
3520
3483
350
-02
A207
A29
A090
A062
AOS
J897
3a59
AS62
AS22
and up
-01
A483
4443
Mos
A325
A26
A247
A960 A920
A840
NOTE For values of z above 349, use 09999 for the area
Common Critical Valu
-0.0
so00
AB80
ABO1
A761
A681
Confidence | Critical
Vale
Level
090
Use these common values that resut from interpolation:
NOTE For values of below-3.49 use 0.0001 for the area
"Use these common values that result from interpolation
score Area
1645 0.9500
1645
2.575
095
196
I score Are
-L645 0.0500
0.9950
099
2575
-2575 0.005o

Transcribed Image Text:Find the area of the shaded region. The graph to the right depicts IQ scores of adults, and those scores are normally distributed with a mean of 100 and a standard deviation of 15.
Click to view page 1 of the table. Click to view page 2 of the table
125
The area of the shaded region is . (Round to four decimal places as needed.)
Expert Solution
This question has been solved!
Explore an expertly crafted, step-by-step solution for a thorough understanding of key concepts.

Step by stepSolved in 2 steps with 2 images

Knowledge Booster


Learn more about
Need a deep-dive on the concept behind this application? Look no further. Learn more about this topic, statistics and related others by exploring similar questions and additional content below.Similar questions
- = The data show the distance (in miles) from an airport of a sample of 22 inbound and outbound airplanes. Use technology to answer parts (a) and (b). a. Find the data set's first, second, and third quartiles. b. Draw a box-and-whisker plot that represents the data set. D 3.2 2.6 3.3 5.9 5.4 3.5 2.6 2.2 5.7 2.9 2.8 2.7 4.3 2.1 1.9 4.6 2.6 5.4 3.6 2.4 5.5 2.2 a. Find the three quartiles. Q₁ Q₂ d (Type integers or decimals. Do not round.) b. Choose the correct box-and-whisker plot below.arrow_forwardWhat is the mean of data setarrow_forwardRun the descriptive statistics for hrs/week of exercise. Include the mean, median, quartiles, min, max, standard deviation and IQR. First do this for hrs/week of exercise overall. Copy and paste the values below. Then redo this splitting up the data by sex. Copy and paste that below too. What similarities and/or differences do you see? Age Gender Height Arm Length Number Siblings Birth Order Handedness Number Classes Number Credits Hrs. Exercise Athlete at Broome Hrs. TV Award Pulse Number Piercings Facebook Friends Followers on Instagram Tattoo Division Local section 18 f 63 27.5 2 3 r 4 14 1.5 n 3 NP 74 2 82 72 n HS y 4 19 m 74 31.5 4 5 r 4 11 5 n 1.5 O 0 600 700 n STEM y 4 17 f 66 29.2 2 2 l 6 15 5 y 21 NP 64 2 1801 1370 n HS y 4 18 f 66 30 5 5 r 4 12 30 n 15 NP 91 1…arrow_forward
- Please give me answer immediately.arrow_forwardWould enjoy the help. 4arrow_forwardUse the birth weights (grams) of 50 babies from the data set "Births." Use software or a calculator to find the mean and median. Examine the list of birth weights to make an observation about those numbers. How does that observation affect the way that the results should be rounded? Click the icon to view the birth weight data. - X The mean birth weight is Birth weights (grams) grams. (Round to one decimal place as needed.) 300 4900 4000 3600 3400 3000 3700 2900 3700 3100 3400 3500 4100 3200 2900 2800 3500 3100 3300 3800 3800 2300 3300 2600 2400 3400 3300 4000 2800 3600 3100 2800 2800 2500 2600 2700 2600 3000 2900 3600 300 3400 3500 3400 3600 3400 3200 2600 3600 3500arrow_forward
- Write one paragraph describing the data set using the histogram. Comment on the shape of the distribution of the data.arrow_forwardThe amount of caffeine in a sample of five-ounce servings of brewed coffee is shown in the histogram. Make a frequency distribution for the data. Then use the table to estimate the sample mean and the sample standard deviation of the data set. Click the icon to view the histogram. Graph/chart Midpoint x xt Ay 30+ 2 70.5 141 24 14 92.5 1295 25- 24 114.5 2748 20- 7 136.5 955.5 14 15- 3 158.5 475.5 10- 7 ΣΤ- 50 Exf = 5615 5- Find the mean of the data set. 48.5 70.5 92.5 114.5 136.5 158.5 x = 112.3 (Round to the nearest tenth as needed.) Complete the table. Round values to the nearest tenth as needed. Midpoint x (x-x)? (x-x)?f Print Done X-X 70.5 - 41.8 1747.2 3494.5 92.5 1295 85556.3 119787.5arrow_forwardThe data represent the number of miles traveled by 10 delivery drivers in a community for one day. What is the first quartile of miles driven? GeoGebra Graphing Calculator 261 215 232 218 218, 223, 211, 299, 231, 245, 261, 278, 212, 233arrow_forward
- The list shows the test scores of students in a math class on the midterm exam. 84, 95, 76, 84, 87, 90, 93, 81, 57, 78, 85, 92Which box - and - whisker plot correctly displays the information?arrow_forward(6) Below is the exam score for 11 students: 90, 83, 89, 66, 80, 87, 95, 94, 70, 92, 83 Construct a stem-and-leaf plot for the data set, using the tenth digit as the stem and the unit digit as the leaf.arrow_forwardIn Exercise, we have provided simple data sets for you to practice the basics of finding measures of variation. For each data set, determine the a.range.b.sample standard deviation. 4, 0, 5arrow_forward
arrow_back_ios
arrow_forward_ios
Recommended textbooks for you
- MATLAB: An Introduction with ApplicationsStatisticsISBN:9781119256830Author:Amos GilatPublisher:John Wiley & Sons Inc
 Probability and Statistics for Engineering and th...StatisticsISBN:9781305251809Author:Jay L. DevorePublisher:Cengage Learning
 Statistics for The Behavioral Sciences (MindTap C...StatisticsISBN:9781305504912Author:Frederick J Gravetter, Larry B. WallnauPublisher:Cengage Learning
  Elementary Statistics: Picturing the World (7th E...StatisticsISBN:9780134683416Author:Ron Larson, Betsy FarberPublisher:PEARSON
 The Basic Practice of StatisticsStatisticsISBN:9781319042578Author:David S. Moore, William I. Notz, Michael A. FlignerPublisher:W. H. Freeman
 Introduction to the Practice of StatisticsStatisticsISBN:9781319013387Author:David S. Moore, George P. McCabe, Bruce A. CraigPublisher:W. H. Freeman
MATLAB: An Introduction with Applications
Statistics
ISBN:9781119256830
Author:Amos Gilat
Publisher:John Wiley & Sons Inc
Probability and Statistics for Engineering and th...
Statistics
ISBN:9781305251809
Author:Jay L. Devore
Publisher:Cengage Learning
Statistics for The Behavioral Sciences (MindTap C...
Statistics
ISBN:9781305504912
Author:Frederick J Gravetter, Larry B. Wallnau
Publisher:Cengage Learning
Elementary Statistics: Picturing the World (7th E...
Statistics
ISBN:9780134683416
Author:Ron Larson, Betsy Farber
Publisher:PEARSON
The Basic Practice of Statistics
Statistics
ISBN:9781319042578
Author:David S. Moore, William I. Notz, Michael A. Fligner
Publisher:W. H. Freeman
Introduction to the Practice of Statistics
Statistics
ISBN:9781319013387
Author:David S. Moore, George P. McCabe, Bruce A. Craig
Publisher:W. H. Freeman