FINANCIAL ACCOUNTING
10th Edition
ISBN: 9781259964947
Author: Libby
Publisher: MCG
expand_more
expand_more
format_list_bulleted
Question
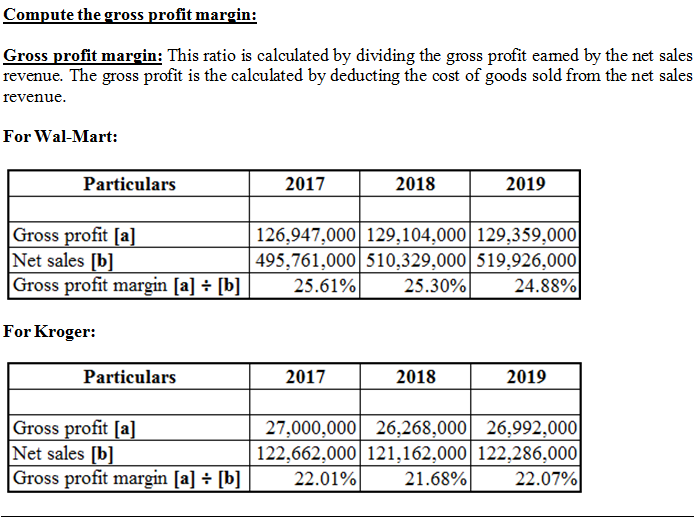
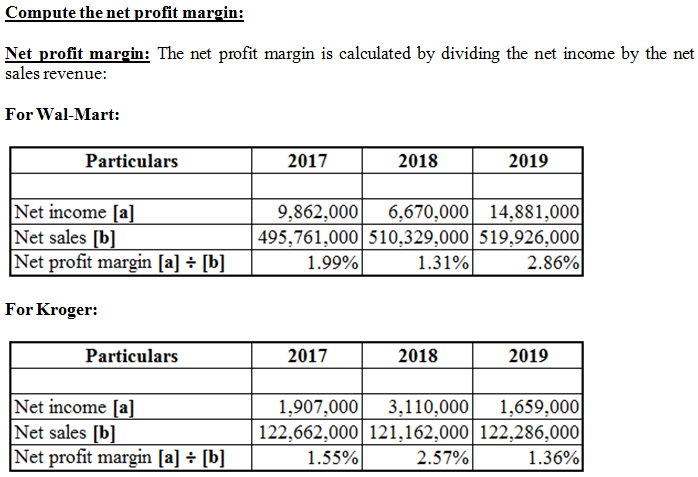
Find gross profit margin, profit margin, return on assets, and return on equity for both companies for years 2017, 2018, and 2019.

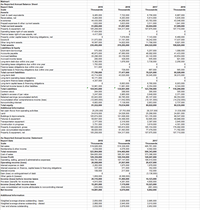
Transcribed Image Text:Walmart
As Reported Annual Balance Sheet
Report Date
2019
2018
2017
2016
Scale
Thousands
Thousands
Thousands
Thousands
Assets
6,867,000
5,835,000
43,046,000
1,941,000
57,689,000
107.710,000
Cash & cash equivalents
Receivables, net
9,465,000
7,722,000
6,756,000
6,283,000
44,269,000
6.284.000
44,435,000
1,622,000
61,806,000
105,208,000
5,614,000
43,783,000
3,511,000
59,664,000
107,675,000
Inventories
Prepaid expenses & other current assets
3,623,000
61,897,000
104,317,000
Total current assets
Property & equipment, net
Operating lease right-of-use assets
Finance lease right-of-use assets, net
Property under capital lease & financing obligations, net
Goodwill
17,424,000
4,417,000
7,078,000
31,181,000
14,822,000
219,295,000
7,143,000
18,242,000
11,798,000
204,522,000
6,468,000
17,037,000
9,921,000
198,825,000
31,073,000
Other long-term assets
Total assets
16,567,000
236,495,000
Liabilities & Equity
Short-term borrowings
Accounts payable
575,000
46,973,000
22,296,000
280,000
5,362,000
1,793,000
5,225,000
47,060,000
22,159,000
428,000
1,876,000
5,257,000
46,092,000
22,122,000
645,000
3,738,000
1,099,000
41,433,000
20,654,000
921,000
2,256,000
Accrued liabilities
Accrued income taxes
Long-term debt due within one year
Operating lease obligations due within one year
Finance lease obligations due within one year
Capital lease & financing obligations due within one year
511,000
77,790,000
43,714,000
16,171,000
729,000
77,477,000
43,520,000
667,000
78,521,000
30,045,000
565,000
66.928,000
Total current liabilities
Long-term debt
Long-term operating lease obligations
Long-term finance lease obligations
Long-term capital lease & financing obligations
36,015,000
4,307,000
12,961,000
154,943,000
284,000
3,247,000
83,943,000
(12,805,000)
6,883,000
81,552,000
6,683,000
11,981,000
139,661,000
288,000
2,965,000
80,785,000
(11,542,000)
6,780,000
8,354,000
123,700,000
295,000
2,648,000
85,107,000
(10,181,000)
6,003,000
9,344,000
118,290,000
305,000
2,371,000
89,354,000
(14,232,000)
2,737,000
80,535,000
Deferred income taxes & other liabilities
Total Liabilities
Common stock
Capital in excess of par value
Retained earnings (accumulated deficit)
Accumulated other comprehensive income (loss)
Noncontrolling interest
Total equity
7,138,000
79,634,000
2,953,000
80,822,000
Additional Information
27.753.000
Net cash flows from operating activities
Land
Buildings & improvements
Fixtures & equipment
25.255.000
28,337,000
31,530,000
24,619,000
105,674,000
58,607,000
24,526,000
101,006,000
54,488,000
2,316,000
3,474,000
185,810,000
81.493,000
104,317,000
25,298,000
101,155,000
52,695,000
2,387,000
3,619,000
185,154,000
77,479,000
107,675,000
24,801,000
98,547,000
48,998,000
2,845,000
4,301,000
179,492,000
71,782,000
107,710,000
Transportation equipment
Construction in progress
2,377,000
Property & equipment, gross
Less: accumulated depreciation
Property & equipment, net
3,751,000
195,028,000
89,820,000
105,208,000
As Reported Annual Income Statement
Report Date
2019
2018
2017
Scale
Thousands
Thousands
Thousands
519,926,000
4,038,000
523,964,000
394,605,000
510,329,000
4,076,000
514,405,000
385,301,000
129,104,000
107,147,000
21,957,000
1,975,000
Net sales
495,761,000
4,582,000
500,343,000
373,396,000
126,947,000
106,510,000
20,437,000
1,978,000
352,000
152,000
(3,136,000)
Membership & other income
Total revenues
Cost of sales
Gross Profit
Operating, selling, general & administrative expenses
Operating income (loss)
Interest expense on debt
Interest expense on finance, capital lease & financing obligations
Interest income
Gain (loss) on extinguishment of debt
Other gains & (losses)
129,359,000
108,791,000
20,568,000
2,262,000
337,000
189,000
371,000
217,000
1,958,000
20,116,000
4,915,000
15,201,000
(320,000)
14,881,000
(8,368,000)
11,460,000
4,281,000
7,179,000
15,123,000
4,600,000
Income (loss) before income taxes
Provision (benefit) for income taxes
Income (loss) after income taxes
Less consolidated net income attributable to noncontrolling interest
Net Income
10,523,000
(509,000)
6,670,000
(661,000)
9,862,000
Additional Information
Weighted average shares outstanding - basic
Weighted average shares outstanding - diluted
Year end shares outstanding
2.850,000
2,868,000
2,832,000
2,929,000
2,945,000
2,878,000
2,995,000
3,010,000
2,952,000

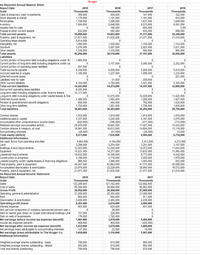
Transcribed Image Text:Kroger
As Reported Annual Balance Sheet
Report Date
2018
Thousands
2019
2017
2016
Scale
Thousands
Thousands
Thousands
Cash & temporary cash investments
Store deposits in-transit
Receivables
399,000
1,179,000
1,706,000
7,084,000
429,000
1,181,000
1,589,000
6.846.000
166,000
592,000
10,803,000
21,635,000
347,000
1,161,000
1,637,000
6.533,000
322,000
910,000
1,649,000
6,561,000
Inventory
604,000
835,000
11,117,000
21,071,000
Assets held for sale
0.00
522,000
10,890,000
21,871,000
898,000
10,340,000
21,016,000
Prepaid & other current assets
Total current assets
Property, plant & equipment, net
Operating lease assets
Intangibles, net
Goodwill
6,814,000
1,066,000
3,076,000
1,258,000
3,087,000
1,335,000
1,100,000
2,925,000
984,000
37,197,000
1,153,000
3,031,000
965,000
36,505,000
Other assets
1,539,000
Total assets
45,256,000
38,118,000
Liabilities
1,965,000
Current portion of long-term debt including obligations under fin
Current portion of long-term debt including obligations under ca
Current portion of operating lease liabilities
Trade accounts payable
Accrued salaries & wages
3,157,000
3,560,000
2,252,000
597,000
6,349,000
1,168,000
6,059,000
1,227,000
5,858,000
1,099,000
5,818,000
1,234,000
251.000
Deferred income taxes
Liabilities held for sale
51,000
3,780,000
14,274,000
259,000
3,421,000
14,197,000
3,305,000
12,860,000
Other current liabilities
Total current liabilities
Noncurrent operating lease liabilities
Long-term debt including obligations under finance leases
Long-term debt including obligations under capital leases & fina
Deferred income taxes
4,164,000
14,243,000
6,505,000
12,111,000
12,072,000
1,562,000
494,000
1,881,000
30,283,000
12,029,000
11,825,000
1,927,000
1,524,000
1,659,000
29,795,000
1,466,000
608,000
1,568,000
792,000
Pension & postretirement benefit obligations
Other long-term liabilities
1,750,000
36,683,000
1,706,000
Total liabilities
30,292,000
1.918,000
3,161,000
(471,000)
17,007,000
14,684,000
(26,000)
6,905,000
1,918,000
3,070,000
(715,000)
15,543,000
13,118,000
12,000
6,710,000
Common shares
1.918.000
1,918,000
3,245,000
(346,000)
19,681,000
16,612,000
(51,000)
7,835,000
Additional paid-in capital
3,337,000
(640,000)
20,978,000
16.991,000
Accumulated other comprehensive income (loss)
Retained earnings (accumulated deficit)
Common shares in treasury, at cost
Noncontrolling interests
Total equity (deficit)
Additional Information
Net cash flows from operating activities
Land
(29,000)
8,573,000
4,664,000
3,299,000
12,553,000
15,031,000
10,832,000
3,166,000
966,000
45,847,000
4,164,000
3,254,000
12,245,000
14,277,000
10,306,000
3,413,000
3,201,000
12,072,000
13,635,000
9,773,000
2,050,000
1,000,000
41,731,000
20,660,000
21,071,000
4.272.000
Buildings & land improvements
Equipment
Leasehold improvements
Construction-in-progress
Leased property under capital leases & financing obligations
Total property, plant & equipment
Accumulated depreciation & amortization
Property, plant & equipment, net
As Reported Annual Income Statement
Report Date
3,197,000
11,643,000
13,495,000
9,342,000
1,979,000
932,000
40,588,000
2,716,000
1,066,000
43,864,000
22,229,000
21,635,000
23,976,000
19.572.000
21,871,000
21,016,000
2019
2018
2017
Scale
Thousands
Thousands
Thousands
122,286,000
95,294,000
26,992,000
21,208,000
884,000
2,649,000
Sales
121,162,000
94,894,000
26,268,000
20,305,000
884,000
2,465,000
2,614,000
620,000
26,000
228,000
1,782,000
3,978,000
900,000
3,078,000
32,000
3,110,000
Cost of sales
122,662,000
95,662,000
27,000,000
21,568,000
911,000
2,436,000
2,085,000
601,000
Gross Profit
Operating, general & administrative
Rent
Depreciation & amortization
Operating profit (loss)
Interest expense
Non-service component of company-sponsored pension plan c
Mark to market gain (loss) on Ocado International Holdings Limit
2,251,000
603,000
157,000
176,000
1,981,000
469,000
1,512,000
Gain on sale of businesses
Net earnings before income tax expense (benefit)
Income tax expense (benefit)
Net earnings after income tax expense (benefit)
Net earnings (loss) attributable to noncontrolling interests
Net earnings (loss) attributable to The Kroger Co.
1,484,000
(405,000)
1,889,000
147,000
1,659,000
18,000
1,907,000
Additional Information
Weighted average shares outstanding - basic
Weighted average shares outstanding - diluted
Year end shares outstanding
799,000
805,000
788,000
810,000
818,000
798,000
895,000
904,000
870,000
Expert Solution
arrow_forward
Step 1
Ratio analysis: This is the quantitative analysis of financial statements of a business enterprise. Under this analysis, different financial indicators are compared to evaluate the efficiency, liquidity, and profitability of the enterprise.
arrow_forward
Step 2


Step by stepSolved in 3 steps with 4 images

Knowledge Booster
Learn more about
Need a deep-dive on the concept behind this application? Look no further. Learn more about this topic, accounting and related others by exploring similar questions and additional content below.Similar questions
- Show how the ROCE ratio for ABC Ltd. the company that we have been discussing this week can be analysed into the two elements (Operating profit margin and sales revenue to capital employed) for each of the years 2018 and 2019. What conclusions can you draw from your figures?arrow_forwardUsing the fiscal year end 2020 annual report for General Mills, Inc. and the figures from the 2020 annual report as noted below, calculate the financial ratios for 2020 and 2019 indicated using the EXCEL template provided:1. The average collection period 2.Days sales in inventory 3. debt to equity ratio 4. Times interest earned 5. Operating cash flow to Capital expenditures ratio 6. Earnings per share 7. Price earnings ratio 8. Dividend yield 9. Dividend payout ratio 10. Total assets 2020 = $30,806.7Total stockholders’ equity 2020 = $8,349.5Total current liabilities 2020 = $7,491.5Accounts receivable 2020 = $1,615.1Inventory 2020 = $1,426.3Year-end closing stock price May 2020 = $58.80Year-end closing stock price May 2019 = $53.56arrow_forwardBegin by calculating the gross profit for each year, then prepare a horizontal analysis of revenues and gross profitlong dash—both in dollar amounts and in percentageslong dash—for 20192019 and 20182018. (Enter amounts in millions as provided to you in the problem statement. Round the percentages to one decimal place, X.X%. Use a minus sign or parentheses to indicate a decrease.) McDonald Corp. Income Statement - (Partial) Years Ended December 31, 2019 and 2018 (Amounts in millions) 2019 2018 2017 Revenues $9,575 $9,300 $8,975 Cost of Goods Sold 6,250 6,000 5,890 Gross Profitarrow_forward
- Calculate the financial indicators of the firm Merck for the year 2018 and fill in the spaces marked in the table. Company Name: Year 2018 Chemicals and Allied Products Industry Ratios ………….. Solvency or Debt Ratios Merck J&J 2018 Debt ratio …. …. 0.47 Debt-to-equity ratio …. …. 0.38 Interest coverage ratio …. …. -9.43 Liquidity Ratios Current ratio …. …. 3.47 Quick ratio …. …. 2.12 Cash ratio …. …. 2.24 Profitability Ratios Profit margin …. …. -93.4% ROE (Return on equity), after tax …. …. -248.5 ROA (Return on assets) …. …. -146.5 Gross margin …. …. 55.3% Operating margin (Return on sales) …. …. -42.9% Activity or Efficiency Ratios Asset turnover …. …. 1.08 Receivables turnover (days) …. …. 16 Inventory turnover (days)…arrow_forwardObtain Target Corporation's annual report for its 2018 fiscal year (year ended February 2, 2019) at http://investors.target.com a. What was Target's gross margin percentage for the fiscal year ended February 2, 2019 (2018) and 2017? Use "Sales" for these computations b. What was Target's Return on Sales percentage for 2018 and 2017? Use "Total Revenue" for these computations. c. Target's return on ales percentage for 2017 was higher than it was in 2018. Ignoring taxes, how much higher would Target's 2018 net income have been if it's return on sales percentage in 2018 had been the same as for 2017?arrow_forwardWith a given information below: (A) Prepare Income Statement and Balance Sheet in the Year 2020. (B) Analyze Income Statement and Balance Sheet in the Year 2020 Vertically. (C) Compute Financial Ratios: (1) ROE, (2) ROA, (3) Average Collection Period, (4) Debt to Asset, (5) Debt to Equity, (6) Time Interest Earned, (7) Total Assets Turnover, (8) Operating Profit Margin, (9) Return On Common Equity (ROCE), (10) Net Working Capital Ratio, (11) Quick Ratio, (12) Current Ratio. Cash $6,000 Sales $100,000 Utility Expense $8,000 Buildings $65,000 Common Stock $45,000 Accounts Payable $12,000 Supplies $4,000 Cost of Goods Sold $58,000 Interest Expense $5,000 Additional Paid in Capital $20,000 Bonds Payable $40,000 Supplies Expense $3,000 Salaries Expense $16,000 Accounts Receivable $10,000 Inventories $45,000 Retained Earnings $5,000 (beg. bal.) Income Tax Rate 20%arrow_forward
- The image uploaded is the calculation of Societe Generale Profitability ratios, shorter liquidity ratios, long-term liquidity ratios, and investment ratios for 2020, 2021, 2022. A base year of 2019 was also added. Evaluate the financial performance by comparing the three (3) years' financial performance that is 2020, 2021, and 2022 I have provided in the table with the base year.arrow_forwardProjecting NOPAT and NOA Using Parsimonious Forecasting Method Following are Logitech's sales, net operating profit after tax (NOPAT), and net operating assets (NOA) for its fiscal year ended March 31, 2019 ($ thousands). Note: Complete the entire question using the following Excel template: Excel Template. Then enter the answers into the provided spaces below with two decimal places. Financial information Net sales Net operating profit after tax (NOPAT) Net operating assets (NOA) $2,788,322 211,362 571,823 Use the parsimonious method to forecast Logitech's sales, NOPAT, and NOA for fiscal years ended March 31, 2020 through 2023 using the following assumptions. Note: Complete the entire question in Excel (template provided above). Using Excel, format each answer to two decimal places. Use Increase Decimal or Decrease Decimal to adjust decimal places. Do not round answers. Then enter the answers into the provided spaces below with two decimal places_. Note: When completing the question…arrow_forwardUse the Ulta annual report to calculate profit margin, total debt ratio, and cash ratio for the year ending in 2021.arrow_forward
- please step by step solution.arrow_forwardF. Based on Baker’s account balances, the amount of Net Income that would be shown on Baker’s Income Statement for December 2017 would be:arrow_forwardCalculate the Current Ratio, Debt Ratio, Return on Assets (ROA) and Return on Equity (ROE). For the ROA and ROE, you should use the average total assets and the average total equity in your calculations. (The average is the total across two years divided by two). Calculate these values for each of 2011-2014. Interpret your calculations: what does this information mean? How is the company doing?arrow_forward
arrow_back_ios
SEE MORE QUESTIONS
arrow_forward_ios
Recommended textbooks for you

 AccountingAccountingISBN:9781337272094Author:WARREN, Carl S., Reeve, James M., Duchac, Jonathan E.Publisher:Cengage Learning,
 Accounting Information SystemsAccountingISBN:9781337619202Author:Hall, James A.Publisher:Cengage Learning,
 Horngren's Cost Accounting: A Managerial Emphasis...AccountingISBN:9780134475585Author:Srikant M. Datar, Madhav V. RajanPublisher:PEARSON
 Intermediate AccountingAccountingISBN:9781259722660Author:J. David Spiceland, Mark W. Nelson, Wayne M ThomasPublisher:McGraw-Hill Education
 Financial and Managerial AccountingAccountingISBN:9781259726705Author:John J Wild, Ken W. Shaw, Barbara Chiappetta Fundamental Accounting PrinciplesPublisher:McGraw-Hill Education


Accounting
Accounting
ISBN:9781337272094
Author:WARREN, Carl S., Reeve, James M., Duchac, Jonathan E.
Publisher:Cengage Learning,

Accounting Information Systems
Accounting
ISBN:9781337619202
Author:Hall, James A.
Publisher:Cengage Learning,

Horngren's Cost Accounting: A Managerial Emphasis...
Accounting
ISBN:9780134475585
Author:Srikant M. Datar, Madhav V. Rajan
Publisher:PEARSON

Intermediate Accounting
Accounting
ISBN:9781259722660
Author:J. David Spiceland, Mark W. Nelson, Wayne M Thomas
Publisher:McGraw-Hill Education

Financial and Managerial Accounting
Accounting
ISBN:9781259726705
Author:John J Wild, Ken W. Shaw, Barbara Chiappetta Fundamental Accounting Principles
Publisher:McGraw-Hill Education