Economics Today and Tomorrow, Student Edition
1st Edition
ISBN: 9780078747663
Author: McGraw-Hill
Publisher: Glencoe/McGraw-Hill School Pub Co
expand_more
expand_more
format_list_bulleted
Question
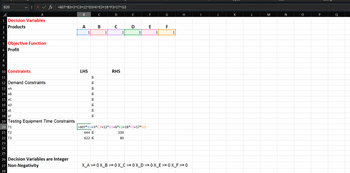
hello so i got a question and i need to use linear programming and i answered it only half can you show me how and the answer using excel for the question please.

Transcribed Image Text:B20
× ✓ fx
A
1 Decision Variables
2 Products
12345678
5 Objective Function
6 Profit
9
10 Constraints
11
12 Demand Constraints
13 XA
14 XB
15 XC
16 xD
17 XE
18 xF
C
D
E
F
G
H
J
K
L
M
N
P
Q
=607*B3+3*C3+12*D3+6*E3+18*F3+17*G3
B
A
B
C
D
E
1
1
1
1
1
LHS
19 Testing Equipment Time Constraints
20 T1
21 T2
22 T3
23
24
25
26 Decision Variables are Integer
27 Non-Negativity
28
VI VI VI VI VI VI VI VI
RHS
|=607*B3+3*C3+12*D3+6*E3+18*F3+17*G3
644
622≤
100
80
F
1
X_A0X_BOX_C0X_D>=0X_E=0X_F>=0

Transcribed Image Text:File
Home
Insert Draw Design Layout
References Mailings Review View Help
Х
Aptos Display (Head | 11
▾ Aˆ A
Paste
BIU ab X
x² A
Aa A
A ▾
་
Normal No Spacing Heading
Heading 2
Title
H
v
Clipboard ✓
Font
✓
Paragraph
√☑
Styles
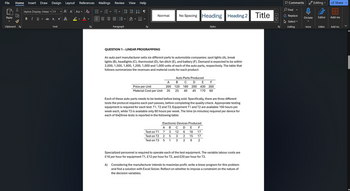
QUESTION 1 - LINEAR PROGRAMMING
An auto part manufacturer sells six different parts to automobile companies: spot lights (A), break
lights (B), headlights (C), thermostat (D), fan ditch (E), and battery (F). Demand is expected to be within
2,000, 1,500, 1,800, 1,200, 1,000 and 1,000 units of each of the auto parts, respectively. The table that
follows summarizes the revenues and material costs for each product:
Auto Parts Produced
Price per Unit
Material Cost per Unit
A
B
C D E F
200 120 180
200 430 260
35 25 40 45 170 60
Each of these auto parts needs to be tested before being sold. Specifically, there are three different
tests the protocol requires each part passes, before completing the quality check. Appropriate testing
equipment is required for each test: T1, T2 and T3. Equipment T1 and T2 are available 100 hours per
week each, while T3 is available only 80 hours per week. The time (in minutes) required per device for
each of the three tests is reported in the following table:
Electronic Devices Produced
A B C D E F
Test on T1
7
3
12 6
18
17
Test on T2
2
5
3
2
15
17
Test on T3
5
1
3
2
9
2
Specialized personnel is required to operate each of the test equipment. The variable labour costs are
£16 per hour for equipment T1, £12 per hour for T2, and £20 per hour for T3.
A) Considering the manufacturer intends to maximize profit, write a linear program for this problem
and find a solution with Excel Solver. Reflect on whether to impose a constraint on the nature of
the decision variables.
K>>
Comments
Find ▾
Editing
Share
Ө
Replace
Select
Editor
Dictate
Add-ins
Editing
Voice
Editor
Add-ins
Expert Solution
This question has been solved!
Explore an expertly crafted, step-by-step solution for a thorough understanding of key concepts.
Step by stepSolved in 2 steps

Knowledge Booster
Similar questions
- Design a process chart for printing a short documenton a laser printer at an office. Unknown to you, the printerin the hallway is out of paper. The paper is located in a supplyroom at the other end of the hall. You wish to make five stapledcopies of the document once it is prin ted. The copier, located nextto the printer, has a sorter but no stapler. How could you makethe task more efficient with the existing equipment?arrow_forwardTyped plz and Asap Please give me a quality solution thanksarrow_forward2spring22 (1) - Protected View Saved to this PC - Search (Alt+Q) erences Mailings Review View Help der Advanced Threat Protection and it hasn't detected any threats. If you need to edit this file, click enable editing. Enable Editing 1- Refer to the information provided in Table1. The table sets out Sue's Surfboards' total product schedule. Answer the following questions. Table 1 Output (surfboards per week) 50 80 125 185 200 220 230 Labor (workers per week) 1 3. 4 7 Calculate the average product of labor b. Calculate the marginal product of labor Over what output range does Sue's Surfboards enjoy the benefits of increased specialization and the division of labor? a. C. d. Over what output range does Sue's Surfboards Experience diminishing marginal product of labor? 0n workers at $650 a week and its totalarrow_forward
- 6. Elasticity and total revenue The following graph shows the daily demand curve for bikes in Houston. Use the green rectangle (triangle symbols) to compute total revenue at various prices along the demand curve. Note: You will not be graded on any changes made to this graph. PRICE (Dollars per bike) 300 275 ) 250 225 175 150 125 100 75 50 25 0 0 + 6 12 18 24 30 36 42 48 QUANTITY (B) Demand 54 60 66 72 Total Revenuearrow_forwardExplain unsolicited mails and communication with children (Ecommerce) in brief. I need to prepare 5-10 minutes presentation for it.arrow_forwardAutoSave fall 2017 chapter 9 - Compatibility Mode - Word P Search Sierra Jameson ff File Home Insert Draw Design Layout References Mailings Review View Help A Share P Comments X Cut - A A Aa v A O Find Palatino Linotype v 10 AaBbCcDd AaBbCcDd AaBbC AaBbCc AaBbC AaBbCcD AaBbCcDd LE Copy E Replace Paste BIU v ab x, x A - evAv 1 Normal 1 No Spac.. Heading 1 Heading 2 Subtle Em... Dictate Sensitivity Title Subtitle S Format Painter A Select v Clipboard Font Paragraph Styles Editing Voice Sensitivity MULTIPLE CHOICE. Choose the one alternative that best completes the statement or answers the question. Figure 15-2 Price and cost per unit P. MC ATC P3 ATC ATC, P2 P, Demand Q, Quantity MR Figure 15-2 above shows the demand and cost curves facing a monopolist. 2) Refer to Figure 15-2. To maximize profit, the firm will produce 2) A) Q1. B) Q2- C) Q3. D) Q4. 3) Refer to Figure 15-2. The firm's profit-maximizing price is 3) A) P1. B) P2. С) Рз. D) P4. 4) Refer to Figure 15-2. If the firm's average…arrow_forward
- 100 90 80 70 60 ATC 50 40 30 AVC 20 MC 10 10 20 30 40 50 60 70 80 90 100 QUANTITY (Thousands of lamps) COSTS (Dollars)arrow_forwardNonearrow_forward"static/nb/ui/evo/index.html?deploymentld=5696051823021770732509536303&elSBN=9781305648173&id=916507517&snapshotld=1950959& * CENGAGE MINDTAP J Homework (Ch 08) Q Search this course Consider the following scenario to understand the relationship between marginal and average values. Suppose Rajiv is a professional basketball player, and his game log for free throws can be summarized in the following table. A-Z Fill in the columns with Rajiv's free-throw percentage for each game and his overall free-throw average after each game. Game Game Result Game Free-Throw Percentage Total Average Free-Throw Percentage 4/5 4/5 80 80 2/5 6/10 3 1/4 7/14 4 1/2 8/16 4/4 12/20 On the following graph, use the orange points (square symbol) to plot Rajiv's free-throw percentage for each game individually, and use the green points (triangle symbol) to plot his overall average free-throw percentage after each game. Note: Plot your points in the order in which you would like them connected. Line segments will…arrow_forward
arrow_back_ios
SEE MORE QUESTIONS
arrow_forward_ios
Recommended textbooks for you
 Economics Today and Tomorrow, Student EditionEconomicsISBN:9780078747663Author:McGraw-HillPublisher:Glencoe/McGraw-Hill School Pub Co

Economics Today and Tomorrow, Student Edition
Economics
ISBN:9780078747663
Author:McGraw-Hill
Publisher:Glencoe/McGraw-Hill School Pub Co
