MATLAB: An Introduction with Applications
6th Edition
ISBN: 9781119256830
Author: Amos Gilat
Publisher: John Wiley & Sons Inc
expand_more
expand_more
format_list_bulleted
Concept explainers
Topic Video
Question

Transcribed Image Text:ul U Mobile Stay Safe 4G
9:49 pm
O O 50% G
IU Mobile Stay Safe 4G 9:39 pm
@ O 96% 4
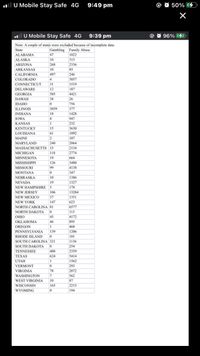
Note: A couple of states were excluded because of incomplete data.
State
Gambling Family Abuse
1022
ALABAMA
47
ALASKA
10
315
ARIZONA
268
2336
ARKANSAS
10
85
CALIFORNIA
497
246
COLORADO
4
3057
CONNECTICUT
31
1519
DELAWARE
12
187
GEORGIA
585
4421
HAWAII
38
26
IDAHO
756
ILLINOIS
3059
377
INDIANA
18
1428
IOWA
8
947
KANSAS
232
KENTUCKY
15
3630
LOUISIANA
61
1092
MAINE
2
107
MARYLAND
240
2064
MASSACHUSETTS 15
2134
MICHIGAN
118
2774
MINNESOTA
MISSISSIPPI
19
664
126
3480
MISSOURI
99
4138
ΜΟΝΤΑΝΑ
347
NEBRASKA
10
1386
NEVADA
19
1327
NEW HAMPSHIRE 5
178
NEW JERSEY
106
13284
NEW MEXICO
37
1351
NEW YORK
147
623
NORTH CAROLINA 81
6577
NORTH DAKOTA
113
OHIO
45
4172
OKLAHOMA
46
895
OREGON
468
PENNSYLVANIA
139
1206
RHODE ISLAND
0
101
SOUTH CAROLINA 321
1136
SOUTH DAKOTA
254
TENNESSEE
408
2359
ΤΕXAS
624
5414
1562
UTAH
VERMONT
293
VIRGINIA
78
2072
WASHINGTON
7.
562
WEST VIRGINIA
10
87
WISCONSIN
165
2215
WYOMING
194

Transcribed Image Text:ull U Mobile Stay Safe 4G
9:49 pm
O 50% 4
O PENDING
Monday, Dec 14, 2020
МАТН
• STATISTICS
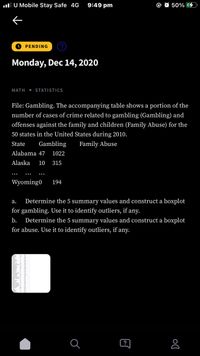
File: Gambling. The accompanying table shows a portion of the
number of cases of crime related to gambling (Gambling) and
offenses against the family and children (Family Abuse) for the
50 states in the United States during 2010.
State
Gambling
Family Abuse
Alabama 47
1022
Alaska
10
315
...
Wyoming0
194
а.
Determine the 5 summary values and construct a boxplot
for gambling. Use it to identify outliers, if any.
b.
Determine the 5 summary values and construct a boxplot
for abuse. Use it to identify outliers, if any.
?
Expert Solution
This question has been solved!
Explore an expertly crafted, step-by-step solution for a thorough understanding of key concepts.
This is a popular solution
Trending nowThis is a popular solution!
Step by stepSolved in 2 steps with 2 images

Knowledge Booster
Learn more about
Need a deep-dive on the concept behind this application? Look no further. Learn more about this topic, statistics and related others by exploring similar questions and additional content below.Similar questions
- A sample of 296 students at a university is surveyed. The students are classified according to gender ("female" or "male"). They are also classified according to major ("biology", "business", "engineering", "mathematics", or "computer science"). The results are given in the contingency table below. Biology Business Engineering Mathematics Female 33 30 22 45 Male 24 43 26 16 Among all the students in the sample, what is the relative frequency of male computer science majors? Round your answer to two decimal places. 1 X Computer science 41 16 Españ Aaarrow_forward2. State the type of sample being collected. The quality control officer at a manufacturing plant needs to determine what percentage of items in a batch are defective. The officer chooses every 15th batch off the line and counts the number of defective items in each chosen batcharrow_forward6. Construct a stem-and-leaf for the data with a 1-digit stem, leaves do NOT need to be in order. 644, 581, 431, 644, 820, 773, 899, 417, 858arrow_forward
- Under each boxplot, write a comment about the presence or absence of any outliers (for example, there are __number of outliers or there are no outliers in the ________data)arrow_forwardOn the following pages you are presented with five problems. Your job is to examine the output and discuss whether there is a statistically significant relationship between the two variables, the pattern or direction of the relationship if the relationship is significant, and the strength of the relationship if the relationship is significant. AS you discuss the strength of the relationship, you will rely on an appropriate measure of association from those that have been given. For that determination, you will need to appropriately determine the level of measurement of each of the variables being examined. Please use the Measures of Association Chart I provided to help you with your determination. You may write your responses on a separate document or next to the problems on this one.arrow_forwardShow work pleasearrow_forward
- In the data set below, 2 is an outlier: 2, 6, 7, 9, 10, 7, 8, 6, 10, 7 O True O Falsearrow_forwardCheck the following data set for outliers. If there is more than one answer, separate them with commas. Select "None" if applicable. , 33, 24, 39, 36, 59, 40 Outliersarrow_forwardA random sample of n=102 was asked what color they most liked to wear as one question in a survey. What type of graph would be best to display the data below? Note: please do not capitalize your answers when typing them. Color Blue Green Red Purple Yellow Orange # of people 20 15 32 18 15 pie graph histogram O box-and-whiskersarrow_forward
- Use the data to identify any outliers.arrow_forwardThe accompanying table shows the result of a national election along with the vote predicted by several organizations in the days before the election. The sample sizes were typically a bit above 1,000 people, and the reported margin of error was around plus or minus 4 percentage points. The percentages for each poll may not sum to 100 because of voters who indicated they were undecided. Complete parts a through c. Click the icon to view the vote predictions and result. a. The News Network 1 poll predicted that 49% were going to vote for Candidate A, with a margin of error of plus or minus 4%. Explain what this means. Select the correct choice below and fill in the answer boxes to complete your choice. (Type integers or decimals. Do not round.) O A. The true proportion of voters for Candidate A is within percentage points of %. O B. The actual proportion of voters for Candidate A is likely to be more than percentage points away from O C. All samples have a sample proportion that is…arrow_forward
arrow_back_ios
arrow_forward_ios
Recommended textbooks for you
 MATLAB: An Introduction with ApplicationsStatisticsISBN:9781119256830Author:Amos GilatPublisher:John Wiley & Sons Inc
 Probability and Statistics for Engineering and th...StatisticsISBN:9781305251809Author:Jay L. DevorePublisher:Cengage Learning
 Statistics for The Behavioral Sciences (MindTap C...StatisticsISBN:9781305504912Author:Frederick J Gravetter, Larry B. WallnauPublisher:Cengage Learning
 Elementary Statistics: Picturing the World (7th E...StatisticsISBN:9780134683416Author:Ron Larson, Betsy FarberPublisher:PEARSON
 The Basic Practice of StatisticsStatisticsISBN:9781319042578Author:David S. Moore, William I. Notz, Michael A. FlignerPublisher:W. H. Freeman
 Introduction to the Practice of StatisticsStatisticsISBN:9781319013387Author:David S. Moore, George P. McCabe, Bruce A. CraigPublisher:W. H. Freeman

MATLAB: An Introduction with Applications
Statistics
ISBN:9781119256830
Author:Amos Gilat
Publisher:John Wiley & Sons Inc

Probability and Statistics for Engineering and th...
Statistics
ISBN:9781305251809
Author:Jay L. Devore
Publisher:Cengage Learning

Statistics for The Behavioral Sciences (MindTap C...
Statistics
ISBN:9781305504912
Author:Frederick J Gravetter, Larry B. Wallnau
Publisher:Cengage Learning

Elementary Statistics: Picturing the World (7th E...
Statistics
ISBN:9780134683416
Author:Ron Larson, Betsy Farber
Publisher:PEARSON

The Basic Practice of Statistics
Statistics
ISBN:9781319042578
Author:David S. Moore, William I. Notz, Michael A. Fligner
Publisher:W. H. Freeman

Introduction to the Practice of Statistics
Statistics
ISBN:9781319013387
Author:David S. Moore, George P. McCabe, Bruce A. Craig
Publisher:W. H. Freeman