
MATLAB: An Introduction with Applications
6th Edition
ISBN: 9781119256830
Author: Amos Gilat
Publisher: John Wiley & Sons Inc
expand_more
expand_more
format_list_bulleted
Related questions
Question
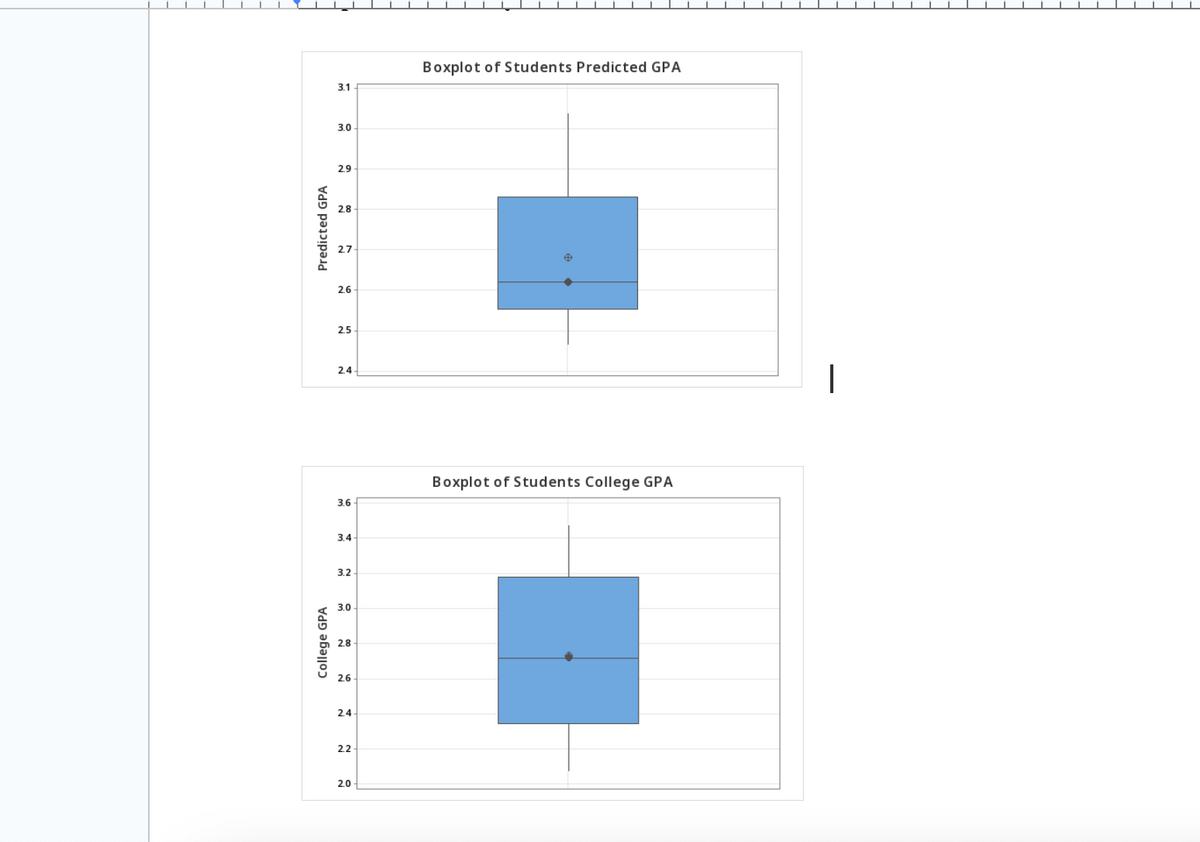
Under each boxplot, write a comment about the presence or absence of any outliers (for example, there are __number of outliers or there are no outliers in the ________data)

Transcribed Image Text:The image contains two boxplots:
1. **Boxplot of Students Predicted GPA:**
- **Title:** Boxplot of Students Predicted GPA
- **Y-Axis:** Predicted GPA
- **Range:** Approximately 2.4 to 3.1
- **Median:** Around 2.65
- **Interquartile Range (IQR):** The box extends from about 2.55 to 2.85
- **Whiskers:** Extend slightly to cover the range from approximately 2.4 to 3.0
- **Outliers:** There is an evident outlier above the third quartile around 2.95.
2. **Boxplot of Students College GPA:**
- **Title:** Boxplot of Students College GPA
- **Y-Axis:** College GPA
- **Range:** Approximately 2.0 to 3.6
- **Median:** Around 2.8
- **Interquartile Range (IQR):** The box extends from about 2.65 to 3.1
- **Whiskers:** Extend to cover a wider range from approximately 2.2 to 3.5
- **Outliers:** No clear outliers are noted beyond the whiskers.
### Interpretation:
Boxplots are utilized to depict the distribution of data based on a five-number summary: minimum, first quartile (Q1), median, third quartile (Q3), and maximum. They are especially useful for identifying outliers. In this comparison:
- The **Predicted GPA** tends to be slightly lower than the actual **College GPA** as seen in the boxplots.
- There is more variability in the actual **College GPA** data, indicated by a wider interquartile range and longer whiskers, suggesting greater spread in student performance.
- The predicted data may have used a model or historical data to forecast student performance, which showed a tighter range of prediction outcomes with a single identified outlier.
Expert Solution
arrow_forward
Step 1: Determine the given data in the question
The two boxplots of students' predicted GPAs and students' college GPAs are given below.
To identify whether the outliers are present in the boxplot.

Step by stepSolved in 3 steps with 2 images

Follow-up Questions
Read through expert solutions to related follow-up questions below.
Follow-up Question
Discuss any outliers in the data . What criteria did you use to identify outliers?
Solution
by Bartleby Expert
Follow-up Questions
Read through expert solutions to related follow-up questions below.
Follow-up Question
Discuss any outliers in the data . What criteria did you use to identify outliers?
Solution
by Bartleby Expert
Knowledge Booster

Similar questions
- Which countries are outliers?arrow_forwardIn the following picture there is a box diagram or two variables containing the annual income of mayors and annual income per person for a sample of 32 towns in Puerto Rico The distribution of annual income of the mayors in this 32 towns of Puerto Rico are: A. Can’t tell B. Symmetric C. Skewed to the left D. Skewed to the rightarrow_forwardDetermine the direction, form, strength, and any outliers on the scatter plot. This scatter plot has a negative association, form is linear, strength is weak, and there are no apparent outliers. This scatter plot has a negative association, form is nonlinear, strength is weak, and there is one possible outlier. This scatter plot has a positive association, form is linear, strength is weak, and there is one possible outlier. This scatter plot has a positive association, form is linear, strength is strong, and there are no apparent outliers.arrow_forward
- The table shows the weekly income of 20 randomly selected full-time students. If the student did not work, a zero was entered. (a) Check the data set for outliers. (b) Draw a histogram of the data. (c) Provide an explanation for any outliers. (a) List all the outliers in the given data set. Select the correct choice below and fill in any answer boxes in your choice. OA. The outlier(s) is/are OB. There are no outliers. (Use a comma to separate answers as needed.) 595 349 0 401 379 439 395 354 434 473 3031 551 224 421 360 508 269 0 310 553arrow_forwardAre cigarettes bad for people? Cigarette smoking involves tar, carbon monoxide, and nicotine (measured in milligrams). The first two are definitely not good for a person's health, and the last ingredient can cause addiction. Use the data in the table above to make a stem-and-leaf display for milligrams of tar per cigarette smoked. (Enter NONE in any unused answer blanks.) Are there any outliers? A. Yes, 1.0 may be an outlier. B. No, there are no outliers. C. Yes, 29.8 may be an outlier.arrow_forwardReview the accompanying scatterplots. Which of the four scatterplots corresponds to the highest R-value? Click the icon to view the scatterplots. Choose the correct answer below. Scatterplots II II IV y y II IV y X Xarrow_forward
- The five number summary of a dataset was found to be: 49, 51, 61, 66, 69 An observation is considered an outlier if it is below: An observation is considered an outlier if it is above: Hint: Help Video Submit Question 17,214 NOV 1 1. PAGES 17 tv MacBook Air ****arrow_forwardPlease see the image below. I believe I have chosen the correct answer for this, but I just want to get a second opinion.arrow_forwardThe five number summary of a dataset was found to be 0, 2, 10, 14, 20 An observation is considered an outlier if it is below: An observation is considered an outlier if it is above: Question Help: Message instructor Submit Questionarrow_forward
- Using the Upper and Lower fences, do the following values have any outliers? 48, 62,13, 64, 59, 42, 102 An outlier above the upper fence Outliers beyond both fences An outlier below the lower fence No outliersarrow_forwardThe five-number summary of a dataset was found to be: 1, 4, 13, 16, 18 An observation is considered an outlier if it is below: An observation is considered an outlier if it is above:arrow_forwardWhich of the following are outliers?arrow_forward
arrow_back_ios
SEE MORE QUESTIONS
arrow_forward_ios
Recommended textbooks for you
- MATLAB: An Introduction with ApplicationsStatisticsISBN:9781119256830Author:Amos GilatPublisher:John Wiley & Sons Inc
 Probability and Statistics for Engineering and th...StatisticsISBN:9781305251809Author:Jay L. DevorePublisher:Cengage Learning
 Statistics for The Behavioral Sciences (MindTap C...StatisticsISBN:9781305504912Author:Frederick J Gravetter, Larry B. WallnauPublisher:Cengage Learning
  Elementary Statistics: Picturing the World (7th E...StatisticsISBN:9780134683416Author:Ron Larson, Betsy FarberPublisher:PEARSON
 The Basic Practice of StatisticsStatisticsISBN:9781319042578Author:David S. Moore, William I. Notz, Michael A. FlignerPublisher:W. H. Freeman
 Introduction to the Practice of StatisticsStatisticsISBN:9781319013387Author:David S. Moore, George P. McCabe, Bruce A. CraigPublisher:W. H. Freeman
MATLAB: An Introduction with Applications
Statistics
ISBN:9781119256830
Author:Amos Gilat
Publisher:John Wiley & Sons Inc
Probability and Statistics for Engineering and th...
Statistics
ISBN:9781305251809
Author:Jay L. Devore
Publisher:Cengage Learning
Statistics for The Behavioral Sciences (MindTap C...
Statistics
ISBN:9781305504912
Author:Frederick J Gravetter, Larry B. Wallnau
Publisher:Cengage Learning
Elementary Statistics: Picturing the World (7th E...
Statistics
ISBN:9780134683416
Author:Ron Larson, Betsy Farber
Publisher:PEARSON
The Basic Practice of Statistics
Statistics
ISBN:9781319042578
Author:David S. Moore, William I. Notz, Michael A. Fligner
Publisher:W. H. Freeman
Introduction to the Practice of Statistics
Statistics
ISBN:9781319013387
Author:David S. Moore, George P. McCabe, Bruce A. Craig
Publisher:W. H. Freeman