Essentials of Economics (MindTap Course List)
8th Edition
ISBN: 9781337091992
Author: N. Gregory Mankiw
Publisher: Cengage Learning
expand_more
expand_more
format_list_bulleted
Question

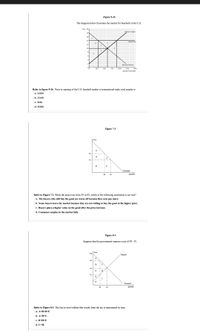
Transcribed Image Text:Figure 9-26
The diagram below illustrates the market for baseballs in the U.S.
Price 20T
Domestic Supphy
18
14
World Pric
12
Doetk Deand
250
500
1500
Quantity of Baseballs
Refer to figure 9-26. Prior to opening of the U.S. baseball market to international trade, total surplus is
a. $4800
b. $2400.
c. $600,
d. $6000,
Figure 7-3
Price
P2
B
P1
D
F
Demand
Q2
Q1
Quantity
Refer to Figure 7-3. When the price rises from P1 to P2, which of the following statements is not true?
a. The buyers who still buy the good are worse off because they now pay more.
b. Some buyers leave the market because they are not willing to buy the good at the higher price.
c. Buyers place a higher value on the good after the price increase.
d. Consumer surplus in the market falls.
Figure 8-5
Suppose that the government imposes a tax of P3 - P1.
Price
P4
Supply
A
P3
B
P2
P1
F
::
Demand
Q2
Q1
Quantity
Refer to Figure 8-5. The loss in total welfare that results from the tax is represented by area
a. A+B+D+F.
b. A+B+C.
c. D+H+F.
d. C+H.
Expert Solution
This question has been solved!
Explore an expertly crafted, step-by-step solution for a thorough understanding of key concepts.
This is a popular solution
Trending nowThis is a popular solution!
Step by stepSolved in 2 steps

Knowledge Booster
Learn more about
Need a deep-dive on the concept behind this application? Look no further. Learn more about this topic, economics and related others by exploring similar questions and additional content below.Similar questions
- Assume a perfectly competitive market and the exporting country is small. Using a demand and supply diagram, show the impact of increasing standards on a low-income exporter of toys. Show the tariffs impact. Is the effect on toy prices the same or different? Why is a standards policy preferred to tariffs?arrow_forwardA tariff is a tax on imported goods. Suppose the U.S. government cuts the tariff on imported flat screen televisions. Using the four-step analysis, how do you think the tariff reduction will affect the equilibrium price and quantity of flat screen TVS?arrow_forwardThe country of Pepperland exports steel to the Land of Submarines. Information for the quantity demanded (Qd) and quantity supplied (Qs) in each country, in a world without trade, are given in Table 34.6 and Table 34.7. What would be the equilibrium price and quantity in each country in a world without trade? How can you tell? What would be the equilibrium price and quantity in each country if trade is allowed to occur? How can you tell? Sketch two supply and demand diagrams, one for each country, in the situation before trade. On those diagrams, show the equilibrium price and the levels of exports and imports in the world after trade. If the Land of Submarines imposes an anti- dumping import quota of 30, explain in general terms whether it will benefit or injure consumers and producers in each country. Does your general answer change if the Land of Submarines imposes an import quota of 70?arrow_forward
- Table 3.8 shows information on the demand and supply for bicycles, where the quantities of bicycles are measured in thousands. What is the quantity demanded and the quantity supplied at a price of 210? At what price is the quantity supplied equal to 48,000? Graph the demand and supply curve for bicycles. How can you determine the equilibrium price and quantity from the graph? How can you determine the equilibrium price and quantity from line table? What HIE die equilibrium price and equilibrium quantity? If the price was 120, what would the quantities demanded and supplied he? Would a shortage or surplus exist? If so, how large would the shortage or surplus he?arrow_forwardWhat is the relationship between quantity Demanded and quantity supplied at equilibrium? What is the relationship when there is a shortage? What is the relationship when them is a surplus?arrow_forwardConsider two ways of protecting elephants from poachers in African countries. In one approach, the government sets up enormous national parks that have sufficient habitat for elephants to thrive and forbids all local people to enter the parks or to injure either the elephants or their habitat in any way. In a second approach, the government sets up national parks and designates 10 villages around the edges of the park as official tourist centers that become places where tourists can stay and bases for guided tours inside the national park. Consider the different incentives of local villagers-who often are very poor-in each of these plans. Which plan seems more likely to help the elephant population?arrow_forward
arrow_back_ios
arrow_forward_ios
Recommended textbooks for you
 Essentials of Economics (MindTap Course List)EconomicsISBN:9781337091992Author:N. Gregory MankiwPublisher:Cengage Learning
 Principles of Economics 2eEconomicsISBN:9781947172364Author:Steven A. Greenlaw; David ShapiroPublisher:OpenStax
 Principles of Economics, 7th Edition (MindTap Cou...EconomicsISBN:9781285165875Author:N. Gregory MankiwPublisher:Cengage Learning
 Principles of Economics (MindTap Course List)EconomicsISBN:9781305585126Author:N. Gregory MankiwPublisher:Cengage Learning
 Principles of Macroeconomics (MindTap Course List)EconomicsISBN:9781285165912Author:N. Gregory MankiwPublisher:Cengage Learning

Essentials of Economics (MindTap Course List)
Economics
ISBN:9781337091992
Author:N. Gregory Mankiw
Publisher:Cengage Learning

Principles of Economics 2e
Economics
ISBN:9781947172364
Author:Steven A. Greenlaw; David Shapiro
Publisher:OpenStax


Principles of Economics, 7th Edition (MindTap Cou...
Economics
ISBN:9781285165875
Author:N. Gregory Mankiw
Publisher:Cengage Learning

Principles of Economics (MindTap Course List)
Economics
ISBN:9781305585126
Author:N. Gregory Mankiw
Publisher:Cengage Learning

Principles of Macroeconomics (MindTap Course List)
Economics
ISBN:9781285165912
Author:N. Gregory Mankiw
Publisher:Cengage Learning