
MATLAB: An Introduction with Applications
6th Edition
ISBN: 9781119256830
Author: Amos Gilat
Publisher: John Wiley & Sons Inc
expand_more
expand_more
format_list_bulleted
Related questions
Question
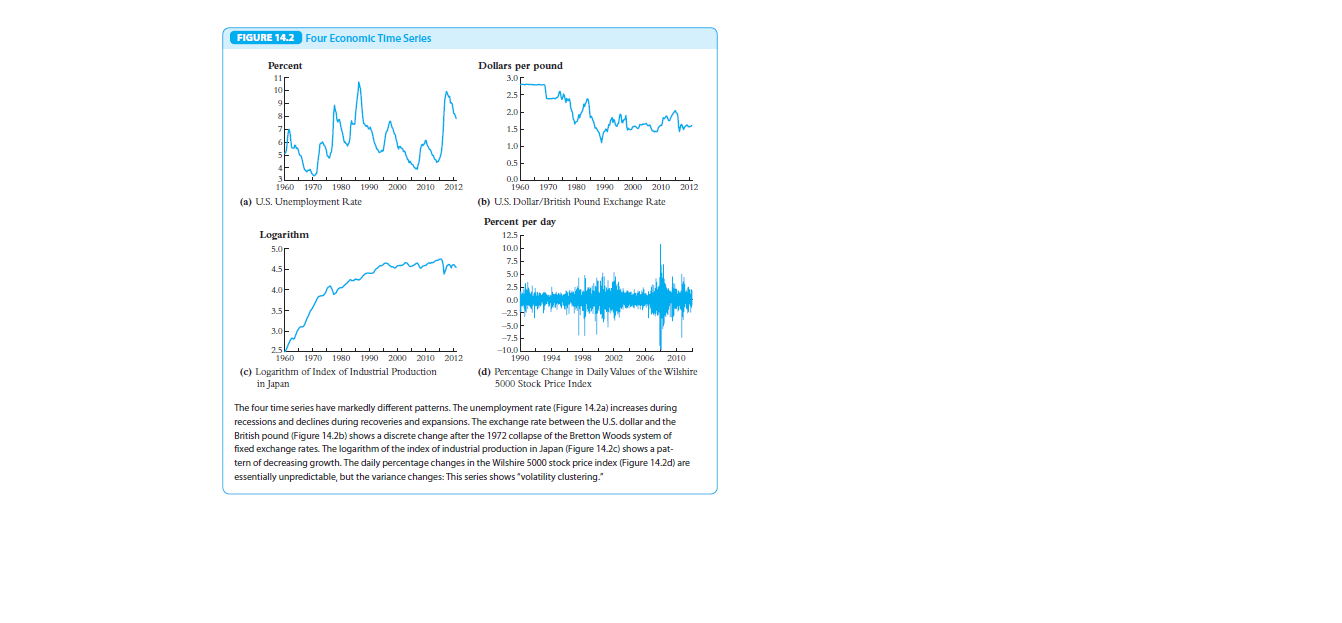
Look at the four plots in Figure 14.2—the US unemployment rate, the
dollar-pound exchange rate, the logarithm of the index of industrial production, and the percentage change in stock prices. Which of these series
appears to be non-stationary? Which of them appears to resemble a random
walk?

Transcribed Image Text:FIGURE 14.2 Four Economic Time Serles
Percent
Dollars per pound
11r
1아
3.0r
2.5
2.아
1.5-
1.0
0.5
-
0.0L
1960 1970 1980 1990 2000 2010 2012
1960 1970 1980 1990 2000 2010 2012
(a) U.S. Unemployment Rate
(b) U.S. Dollar/British Pound Exchange Rate
Percent per day
Logarithm
12.5
5.0r
10.0
7.5
4.5-
5.0
2.5
4.0-
0.0
3.5-
-2.5
-5.0
3.0-
-7.5
25
1960 1970 1980 1990 2000 2010 2012
-10.0
1990 1994
1998 2002
2006
2010
(c) Logarithm of Index of Industrial Production
in Japan
(d) Percentage Change in Daily Values of the Wilshire
5000 Stock Price Index
The four time series have markedly different patterns. The unemployment rate (Figure 14.2a) increases during
recessions and declines during recoveries and expansions. The exchange rate between the U.S. dollar and the
British pound (Figure 14.2b) shows a discrete change after the 1972 collapse of the Bretton Woods system of
fixed exchange rates. The logarithm of the index of industrial production in Japan (Figure 14.2c) shows a pat-
tern of decreasing growth. The daily percentage changes in the Wilshire 5000 stock price index (Figure 14.2d) are
essentially unpredictable, but the variance changes: This series shows "volatility clustering."
Expert Solution
This question has been solved!
Explore an expertly crafted, step-by-step solution for a thorough understanding of key concepts.

This is a popular solution

Trending nowThis is a popular solution!

Step by stepSolved in 2 steps

Knowledge Booster


Learn more about
Need a deep-dive on the concept behind this application? Look no further. Learn more about this topic, statistics and related others by exploring similar questions and additional content below.Similar questions
- The data for this problem are the air freight shipments (in ton-miles) each month (beginning in January for one year) in the U. S. for 10 years. The following is a time series plot of this data. What are the most important features of this plot? Ton-miles 3000- 2500- 2000- 1500- 1000- 1 Time Series Plot of Ton-miles ܚ ܪܘܐܐܐ ܘ ܚܐ ܀ 12 24 36 48 60 Index 72 84 96 108 120arrow_forward.A new, miracle diabetes drug that diminishes major symptoms of diabetes has been approved by the FDA. Health care professionals and researchers believe that the new drug will prolong lifespan of diabetes patients. If the population is in steady state and the incidence is constant, what will the effect of this new drug be on the prevalence of diabetes in the population? Explain.arrow_forward1.8 Compute and compare the total electricity consumption of Sub-Saharan Africa to the United States in 2012. The population of Sub-Saharan Africa was 926 million, and the United States was 314 million. The per person consumption in the United States in 2012 was 12.96 MWh per year. Consult Fig. 1.11 for the per person consumption in Sub-Saharan Africa.arrow_forward
- I need some help with the following problems on excel.arrow_forwardFrom the data in the table it shows the 2019 daily return data for the S&P 500 Index (stocks) and the US 30 year Bond (bonds). How do I test the hypothesis that mean daily return on stocks exceeds the mean daily return on bonds? Please show the steps. S&P500 dailt returns data: Date Price Daily Return 2019-12-31 3230.78 0.294602% 2019-12-30 3221.29 -0.578082% 2019-12-27 3240.02 0.003398% 2019-12-26 3239.91 0.512817% 2019-12-24 3223.38 -0.019545% 2019-12-23 3224.01 0.086614% 2019-12-20 3221.22 0.494478% 2019-12-19 3205.37 0.445929% 2019-12-18 3191.14 -0.043230% 2019-12-17 3192.52 0.033529% US 30 Year Bond Date Price Daily Return 31-Dec-19 2.389 2.32% 30-Dec-19 2.335 0.78% 29-Dec-19 2.317 -0.03% 27-Dec-19 2.318 -0.16% 26-Dec-19 2.321 -0.71% 25-Dec-19 2.338 0.15% 24-Dec-19 2.334 -0.83% 23-Dec-19 2.354 0.31% 22-Dec-19 2.346 0.12% 20-Dec-19 2.344 -0.43%arrow_forwardSuppose that the index model for stocks A and B is estimated from excess returns with the following results: RA= 2.0% + 0.40RM + eA RB = -1.8%+ 0.9RM + eB OM = 15%; R-squareA = 0.30; R-squareB = 0.22 What is the standard deviation of each stock? Note: Do not round intermediate calculations. Round your answers to 2 decimal places. Stock A Stock B Standard Deviation % %arrow_forward
arrow_back_ios
arrow_forward_ios
Recommended textbooks for you
- MATLAB: An Introduction with ApplicationsStatisticsISBN:9781119256830Author:Amos GilatPublisher:John Wiley & Sons Inc
 Probability and Statistics for Engineering and th...StatisticsISBN:9781305251809Author:Jay L. DevorePublisher:Cengage Learning
 Statistics for The Behavioral Sciences (MindTap C...StatisticsISBN:9781305504912Author:Frederick J Gravetter, Larry B. WallnauPublisher:Cengage Learning
  Elementary Statistics: Picturing the World (7th E...StatisticsISBN:9780134683416Author:Ron Larson, Betsy FarberPublisher:PEARSON
 The Basic Practice of StatisticsStatisticsISBN:9781319042578Author:David S. Moore, William I. Notz, Michael A. FlignerPublisher:W. H. Freeman
 Introduction to the Practice of StatisticsStatisticsISBN:9781319013387Author:David S. Moore, George P. McCabe, Bruce A. CraigPublisher:W. H. Freeman
MATLAB: An Introduction with Applications
Statistics
ISBN:9781119256830
Author:Amos Gilat
Publisher:John Wiley & Sons Inc
Probability and Statistics for Engineering and th...
Statistics
ISBN:9781305251809
Author:Jay L. Devore
Publisher:Cengage Learning
Statistics for The Behavioral Sciences (MindTap C...
Statistics
ISBN:9781305504912
Author:Frederick J Gravetter, Larry B. Wallnau
Publisher:Cengage Learning
Elementary Statistics: Picturing the World (7th E...
Statistics
ISBN:9780134683416
Author:Ron Larson, Betsy Farber
Publisher:PEARSON
The Basic Practice of Statistics
Statistics
ISBN:9781319042578
Author:David S. Moore, William I. Notz, Michael A. Fligner
Publisher:W. H. Freeman
Introduction to the Practice of Statistics
Statistics
ISBN:9781319013387
Author:David S. Moore, George P. McCabe, Bruce A. Craig
Publisher:W. H. Freeman