
MATLAB: An Introduction with Applications
6th Edition
ISBN: 9781119256830
Author: Amos Gilat
Publisher: John Wiley & Sons Inc
expand_more
expand_more
format_list_bulleted
Related questions
Concept explainers
Topic Video
Question
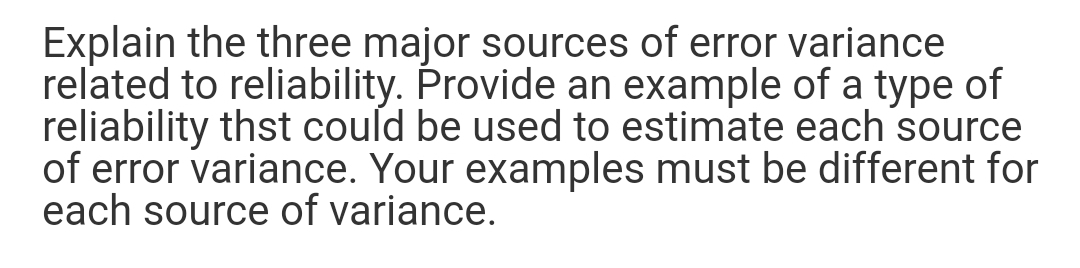

Transcribed Image Text:Explain the three major sources of error variance
related to reliability. Provide an example of a type of
reliability thst could be used to estimate each source
of error variance. Your examples must be different for
each source of variance.
Expert Solution
This question has been solved!
Explore an expertly crafted, step-by-step solution for a thorough understanding of key concepts.

This is a popular solution

Trending nowThis is a popular solution!

Step by stepSolved in 5 steps

Knowledge Booster


Learn more about
Need a deep-dive on the concept behind this application? Look no further. Learn more about this topic, statistics and related others by exploring similar questions and additional content below.Similar questions
- The director of research and development is testing a new medicine. She wants to know if there is evidence at the 0.01 level that the medicine relieves pain in more than 340 seconds. For a sample of 38 patients, the mean time in which the medicine relieved pain was 344 seconds. Assume the variance is known to be 484. Enter the decision rule. Reject Ho if z > _______arrow_forwardplease give detailed responsearrow_forwardOnly the questions asking about the test-statistic and after. (Questions in the secound image)arrow_forward
- You are doing a one way analysis of variance on the fuel consumption of different makes of cars. You measure the fuel consumption of 59 cars in total. The number of car makes is 6 for this experiment. The sum of squares total is 181.55 and the sum of squares treatment is 118.42. Find the sum of squares errors correct to 2 decimal places.arrow_forwardEach problem describes a research situation and the data it produces. Identify the statistical procedure or test that is appropriate for the data. Choose whether the problem requires one of the following: Descriptive statistics (Mean, Standard Deviations, Percentiles), one-sample t-test, Independent-measures t-test, Independent-measures ANOVAs (One-factor or Two-factor), Repeated-measures ANOVA, Linear Regression, Chi-Square Goodness-of-fit, Chi-Square Test of independence. 1) Research has demonstrated that IQ scores have been increasing, generation by generation, for years (Flynn, 1999). A researcher would like to determine whether this trend can be described by a linear equation showing the relationship between age and IQ scores. The same IQ test is given to a sample of 100 adults who range in age from 20 to 85 years. The age and IQ score are recorded for each person. 2) Childhood participation in sports, cultural groups, and youth groups appears to be related to improved…arrow_forwardVariance is a measure of relative position central tendency skew variabilityarrow_forward
- Mean 1 = 17, SD 1=7.89 Mean 2= 89, SD 2= 6.69 R = -0.84 What is the proportion of variance shared between the two variables? (How much of the variance in one variable can be predicted by the variance in the other variable?)arrow_forwardBag-Filling Machines at Jelly Belly. The variance in a production process is an important measure of the quality of the process. A large variance often signals an opportunity for improvement in the process by finding ways to reduce the process variance. Jelly Belly Candy Company is testing two machines that use different technologies to fill three pound bags of jelly beans. The file Bags contains a sample of data on the weights of bags (in pounds) filled by each machine. Conduct a statistical test to determine whether there is a significant difference between the variances in the bag weights for two machines. Use a .05 level of significance. What is your conclusion? Which machine, if either, provides the greater opportunity for quality improvements? Machine 1 Machine 2 1.34 1.46 1.57 1.50 1.59 1.52 1.70 1.49 1.58 1.50 1.48 1.48 1.51 1.50 1.45 1.49 1.44 1.54 1.45 1.52 1.46 1.52 1.54 1.45 1.77 1.52…arrow_forwardWhy Calculation of power is more complex for Analysis of Variance?arrow_forward
- Find the P value for the following example.A data set {Xi} contains 100 house prices in Boston while{Yj} contains 200 house prices in MA. The variances ofBoston and MA are known to be equal but a specificvalue is unknown. We want to test whether the meanhouse price of Boston is higher than the state meanprice. The Boston sample mean and variance are 350Kand (150K)2 while the MA sample mean and varianceare 300K and (50K)2. Use α = 0.05 for the test.arrow_forwardA candy company produces packets of candy every day. Each packet they produce has a slightly unique weight. The mean of the weights is 74g, and the variance of the weights is 13g. What is the minimum weight of a packet of candy with a z-score of -0.2? (round to the nearest tenth as needed)arrow_forwardCan you explain what is above? Estimates of variance can be used to test a hypothesis because?arrow_forward
arrow_back_ios
SEE MORE QUESTIONS
arrow_forward_ios
Recommended textbooks for you
- MATLAB: An Introduction with ApplicationsStatisticsISBN:9781119256830Author:Amos GilatPublisher:John Wiley & Sons Inc
 Probability and Statistics for Engineering and th...StatisticsISBN:9781305251809Author:Jay L. DevorePublisher:Cengage Learning
 Statistics for The Behavioral Sciences (MindTap C...StatisticsISBN:9781305504912Author:Frederick J Gravetter, Larry B. WallnauPublisher:Cengage Learning
  Elementary Statistics: Picturing the World (7th E...StatisticsISBN:9780134683416Author:Ron Larson, Betsy FarberPublisher:PEARSON
 The Basic Practice of StatisticsStatisticsISBN:9781319042578Author:David S. Moore, William I. Notz, Michael A. FlignerPublisher:W. H. Freeman
 Introduction to the Practice of StatisticsStatisticsISBN:9781319013387Author:David S. Moore, George P. McCabe, Bruce A. CraigPublisher:W. H. Freeman
MATLAB: An Introduction with Applications
Statistics
ISBN:9781119256830
Author:Amos Gilat
Publisher:John Wiley & Sons Inc
Probability and Statistics for Engineering and th...
Statistics
ISBN:9781305251809
Author:Jay L. Devore
Publisher:Cengage Learning
Statistics for The Behavioral Sciences (MindTap C...
Statistics
ISBN:9781305504912
Author:Frederick J Gravetter, Larry B. Wallnau
Publisher:Cengage Learning
Elementary Statistics: Picturing the World (7th E...
Statistics
ISBN:9780134683416
Author:Ron Larson, Betsy Farber
Publisher:PEARSON
The Basic Practice of Statistics
Statistics
ISBN:9781319042578
Author:David S. Moore, William I. Notz, Michael A. Fligner
Publisher:W. H. Freeman
Introduction to the Practice of Statistics
Statistics
ISBN:9781319013387
Author:David S. Moore, George P. McCabe, Bruce A. Craig
Publisher:W. H. Freeman