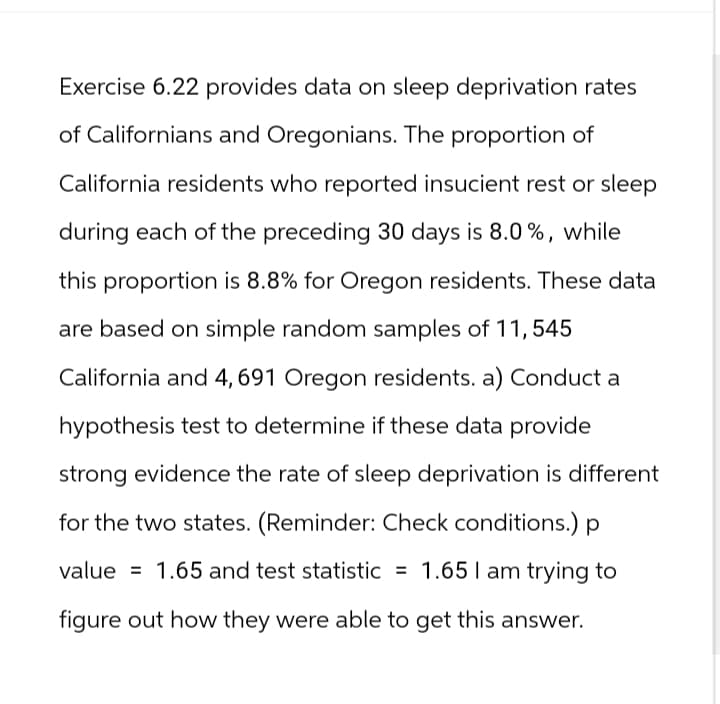
Exercise 6.22 provides data on sleep deprivation rates of Californians and Oregonians. The proportion of California residents who reported insucient rest or sleep during each of the preceding 30 days is 8.0%, while this proportion is 8.8% for Oregon residents. These data are based on simple random samples of 11, 545 California and 4,691 Oregon residents. a) Conduct a hypothesis test to determine if these data provide strong evidence the rate of sleep deprivation is different for the two states. (Reminder: Check conditions.) p value 1.65 and test statistic = 1.65 I am trying to figure out how they were able to get this answer.
Exercise 6.22 provides data on sleep deprivation rates of Californians and Oregonians. The proportion of California residents who reported insucient rest or sleep during each of the preceding 30 days is 8.0%, while this proportion is 8.8% for Oregon residents. These data are based on simple random samples of 11, 545 California and 4,691 Oregon residents. a) Conduct a hypothesis test to determine if these data provide strong evidence the rate of sleep deprivation is different for the two states. (Reminder: Check conditions.) p value 1.65 and test statistic = 1.65 I am trying to figure out how they were able to get this answer.

Holt Mcdougal Larson Pre-algebra: Student Edition 2012
1st Edition
ISBN:9780547587776
Author:HOLT MCDOUGAL
Publisher:HOLT MCDOUGAL
Chapter11: Data Analysis And Probability
Section: Chapter Questions
Problem 8CR

Related questions
Question
Transcribed Image Text:Exercise 6.22 provides data on sleep deprivation rates
of Californians and Oregonians. The proportion of
California residents who reported insucient rest or sleep
during each of the preceding 30 days is 8.0%, while
this proportion is 8.8% for Oregon residents. These data
are based on simple random samples of 11,545
California and 4, 691 Oregon residents. a) Conduct a
hypothesis test to determine if these data provide
strong evidence the rate of sleep deprivation is different
for the two states. (Reminder: Check conditions.) p
=
value 1.65 and test statistic = 1.65 I am trying to
figure out how they were able to get this answer.
Expert Solution
This question has been solved!
Explore an expertly crafted, step-by-step solution for a thorough understanding of key concepts.

This is a popular solution!

Trending now
This is a popular solution!

Step by step
Solved in 3 steps with 3 images

Recommended textbooks for you
Holt Mcdougal Larson Pre-algebra: Student Edition…
Algebra
ISBN:
9780547587776
Author:
HOLT MCDOUGAL
Publisher:
HOLT MCDOUGAL

College Algebra (MindTap Course List)
Algebra
ISBN:
9781305652231
Author:
R. David Gustafson, Jeff Hughes
Publisher:
Cengage Learning
Holt Mcdougal Larson Pre-algebra: Student Edition…
Algebra
ISBN:
9780547587776
Author:
HOLT MCDOUGAL
Publisher:
HOLT MCDOUGAL
College Algebra (MindTap Course List)
Algebra
ISBN:
9781305652231
Author:
R. David Gustafson, Jeff Hughes
Publisher:
Cengage Learning