
MATLAB: An Introduction with Applications
6th Edition
ISBN: 9781119256830
Author: Amos Gilat
Publisher: John Wiley & Sons Inc
expand_more
expand_more
format_list_bulleted
Related questions
Question
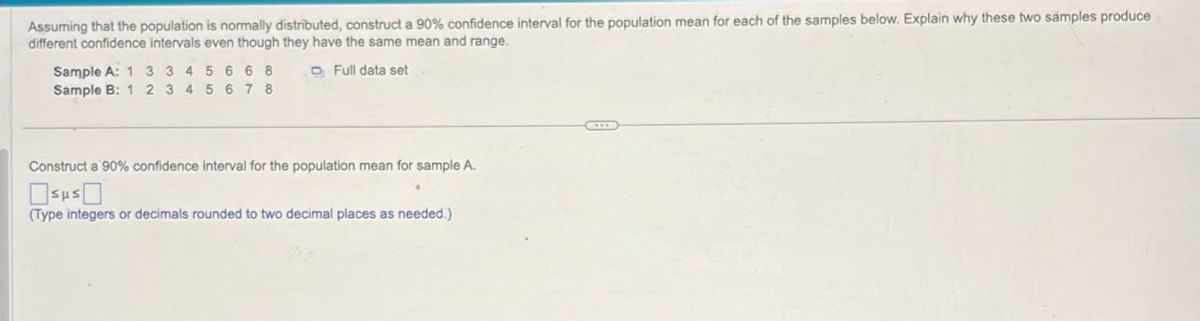

Transcribed Image Text:Assuming that the population is normally distributed, construct a 90% confidence interval for the population mean for each of the samples below. Explain why these two samples produce
different confidence intervals even though they have the same mean and range.
Sample A: 1 3
Sample B: 1 2
3 4 5 6 6 8
3 4 5 6 7 8
Full data set
Construct a 90% confidence interval for the population mean for sample A.
Sus
(Type integers or decimals rounded to two decimal places as needed.)
Expert Solution
This question has been solved!
Explore an expertly crafted, step-by-step solution for a thorough understanding of key concepts.

Step by stepSolved in 3 steps with 9 images

Knowledge Booster

Similar questions
- Please answer parts A & B, the data table is in the picture below. Thank you! :)arrow_forwardWhich one of the following statements about confidence intervals is false? Given the same sample of data, a 99% confidence interval will be wider than a 95% confidence interval. The size of the population affects the width of a confidence interval. The sample statistic determines the center of the confidence interval. The value of z* affects the width of a confidence interval. The general format of a confidence interval is “sample statistic ± margin of error.”arrow_forwardConstruct a 95% confidence interval for the population mean, based on each of the sets of data below, assuming that the population is normally distributed. Explain why these data sets produce different confidence intervals even though they have the same mean and range. Set 1: 1 1 1 1 8 8 8 8 A Full data set Set 2: 1 2 3 4 5 6 7 8 Construct a 95% confidence interval for the population mean for set 1. (Type integers or decimals rounded to two decimal places as needed.)arrow_forward
- Assuming that the population is normally distributed, construct a 99% confidence interval for the population mean for each of the samples below. Explain why these two samples produce different confidence intervals even though they have the same mean and range. Full data set Sample A: 1 2 2 2 7 7 7 8 Sample B: 1 2 3 4 5 6 7 8 Construct a 99% confidence interval for the population mean for sample A. (Type integers or decimals rounded to two decimal places as needed.) Carrow_forwardIf n = 15, ¯xx¯ = 36, and s = 12, construct a confidence interval at a 90% confidence level. Assume the data came from a normally distributed population. Give your answers to three decimal places.arrow_forwardTina catches a 14-pound bass. She does not know the population mean or standard deviation. So she takes a sample of five friends and they say the last bass they caught was 9, 12, 13, 10, and 10 pounds. Find the t and calculate a 95% (α = .05) confidence interval.arrow_forward
- Assuming that the population is normally distributed, construct a 95% confidence interval for the population mean for each of the samples below. Explain why these two samples produce different confidence intervals even though they have the same mean and range. Sample A: 1 2 4 4 5 5 7 8 Full data set Sample B: 1 2 3 4 5 6 7 8 Question content area bottom Part 1 Construct a 95% confidence interval for the population mean for sample A. enter your response here≤μ≤enter your response herearrow_forwardFor the data set below, calculate r, r2, and a 95 percent confidence interval in r units. Then write a one- to two sentence conclusion statement that includes whether the null hypothesis was rejected or not and whether there is a strong /weak/no relationship. Assume a two tailed hypothesis and α = .05. Case 1 Case 2 Case 3 Case 4 Case 5 Case 6 X 1.05 1.15 1.30 2.00 1.75 1.00 Y 2 2 3 4 5 2arrow_forwardIf n=11, 7(x-bar)=45, and s=5, construct a confidence interval at a 95% confidence level. Assume the data came from a normally distributed population. Give your answers to one decimal place.arrow_forward
arrow_back_ios
arrow_forward_ios
Recommended textbooks for you
- MATLAB: An Introduction with ApplicationsStatisticsISBN:9781119256830Author:Amos GilatPublisher:John Wiley & Sons Inc
 Probability and Statistics for Engineering and th...StatisticsISBN:9781305251809Author:Jay L. DevorePublisher:Cengage Learning
 Statistics for The Behavioral Sciences (MindTap C...StatisticsISBN:9781305504912Author:Frederick J Gravetter, Larry B. WallnauPublisher:Cengage Learning
  Elementary Statistics: Picturing the World (7th E...StatisticsISBN:9780134683416Author:Ron Larson, Betsy FarberPublisher:PEARSON
 The Basic Practice of StatisticsStatisticsISBN:9781319042578Author:David S. Moore, William I. Notz, Michael A. FlignerPublisher:W. H. Freeman
 Introduction to the Practice of StatisticsStatisticsISBN:9781319013387Author:David S. Moore, George P. McCabe, Bruce A. CraigPublisher:W. H. Freeman
MATLAB: An Introduction with Applications
Statistics
ISBN:9781119256830
Author:Amos Gilat
Publisher:John Wiley & Sons Inc
Probability and Statistics for Engineering and th...
Statistics
ISBN:9781305251809
Author:Jay L. Devore
Publisher:Cengage Learning
Statistics for The Behavioral Sciences (MindTap C...
Statistics
ISBN:9781305504912
Author:Frederick J Gravetter, Larry B. Wallnau
Publisher:Cengage Learning
Elementary Statistics: Picturing the World (7th E...
Statistics
ISBN:9780134683416
Author:Ron Larson, Betsy Farber
Publisher:PEARSON
The Basic Practice of Statistics
Statistics
ISBN:9781319042578
Author:David S. Moore, William I. Notz, Michael A. Fligner
Publisher:W. H. Freeman
Introduction to the Practice of Statistics
Statistics
ISBN:9781319013387
Author:David S. Moore, George P. McCabe, Bruce A. Craig
Publisher:W. H. Freeman