
MATLAB: An Introduction with Applications
6th Edition
ISBN: 9781119256830
Author: Amos Gilat
Publisher: John Wiley & Sons Inc
expand_more
expand_more
format_list_bulleted
Related questions
Question
Find the chi-square statistics, probability, and determine the degrees of freedom need to be used. Then find the chi-square critical value and p-value.
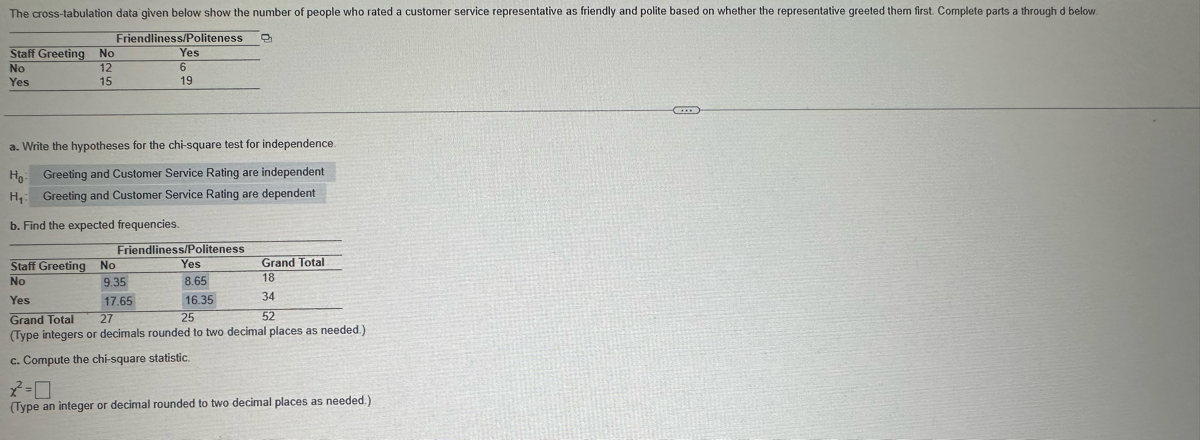

Transcribed Image Text:The cross-tabulation data given below show the number of people who rated a customer service representative as friendly and polite based on whether the representative greeted them first. Complete parts a through d below.
Friendliness/Politeness
Staff Greeting No
No
Yes
Yes
12
15
6
19
a. Write the hypotheses for the chi-square test for independence..
Ho
Greeting and Customer Service Rating are independent
H₁
Greeting and Customer Service Rating are dependent
b. Find the expected frequencies.
Friendliness/Politeness
Staff Greeting No
Yes
Grand Total
No
9.35
8.65
18
Yes
17.65
16.35
34
Grand Total
27
25
52
(Type integers or decimals rounded to two decimal places as needed.)
c. Compute the chi-square statistic.
7-
(Type an integer or decimal rounded to two decimal places as needed.)
Expert Solution
This question has been solved!
Explore an expertly crafted, step-by-step solution for a thorough understanding of key concepts.

This is a popular solution

Trending nowThis is a popular solution!

Step by stepSolved in 4 steps with 12 images

Knowledge Booster

Similar questions
- A college football coach was interested in whether the college's strength development class increased his players' maximum lift (in pounds) on the bench press exercise. He asked four of his players to participate in a study. The amount of weight they could each lift was recorded before they took the strength development class. After completing the class, the amount of weight they could each lift was again measured. What is being tested in this situation and what distribution will be used to conduct the test? Group of answer choices a.Two independent means, normal distribution. b.Single population mean, use the t-distribution. c.Single population mean, use the normal distribution. d.Two independent proportions, use the normal distribution. e.Two independent means, use the Student’s-t distribution.arrow_forwardAn amusement park keeps track of the percentage of individuals with season passes according to age category. An independent tourist company would like to show that this distribution of age category for individuals buying season passes is different from what the amusement park claims. The tourist company randomly sampled 200 individuals entering the park with a season pass and recorded the number of individuals within each age category. Age Category Child (under 13 years old) Teen (13 to 19 years old) Adult (20 to 55 years old) Senior (56 years old and over) Number of Individuals 56 86 44 14 The tourist company will use the data to test the amusement park’s claim, which is reflected in the following null hypothesis. H0:pchild=0.23H0:pchild=0.23, pteen=0.45pteen=0.45, padult=0.20padult=0.20, and psenior=0.12psenior=0.12. What inference procedure will the company use to investigate whether or not the distribution of age category for individuals with season passes is…arrow_forwardA professor wants to know whether or not there is a difference in comprehension of a lab assignment among students depending on if the instructions are given all in text, or if they are given primarily with visual illustrations. She randomly divides her class into two groups of 15, gives one group instructions in text and the second group instructions with visual illustrations. The following data summarizes the scores the students received on a test given after the lab. Let the populations be normally distributed with a population standard deviation of 5.32 points for both the text and visual illustrations. Text (Group 1) Visual Illustrations (Group 2) 57.3 59 45.3 57.6 87.1 72.9 61.2 83.2 43.1 64 87.3 76.7 75.2 78.2 88.2 64.4 67.5 89 86.2 72.9 67.2 88.2 54.4 43.8 93 97.1 89.2 95.1 52 84.1 Is there evidence to suggest that a difference exists in the comprehension of the lab based on the…arrow_forward
- The accompanying data are x = advertising share and y = market share for a particular brand of soft drink during 10 randomly selected years. x 0.104 0.072 0.072 0.077 0.086 0.047 0.060 0.050 0.070 0.052 y 0.137 0.127 0.120 0.086 0.079 0.076 0.065 0.059 0.051 0.039 b)Calculate the equation of the estimated regression line. (Round your answers to four decimal places.) d)Calculate a point estimate of ?e. (Round your answer to five decimal places.)arrow_forwardUse the three distributions labeled i,ii,iii to answer the following questions (shown in picture upload)arrow_forwardA pharmaceutical company makes tranquilizers. It is assumed that the distribution for the length of time they last is approximately normal. Researchers in a hospital used the drug on a random sample of 9 patients. The effective period of the tranquilizer for each patient (in hours) was as follows: 2.5; 2.8; 3.1; 2.3; 2.3; 2.2; 2.8; 2.1; and 2.4. 1.Which distribution should you use for this problem? (Enter your answer in the form z or tdf where df is the degrees of freedom.) 2. Construct a 95% confidence interval for the population mean length of time. (i) State the confidence interval. (Round your answers to two decimal places.) ( , ) (iii) Calculate the error bound. (Round your answer to two decimal places.)arrow_forward
arrow_back_ios
arrow_forward_ios
Recommended textbooks for you
- MATLAB: An Introduction with ApplicationsStatisticsISBN:9781119256830Author:Amos GilatPublisher:John Wiley & Sons Inc
 Probability and Statistics for Engineering and th...StatisticsISBN:9781305251809Author:Jay L. DevorePublisher:Cengage Learning
 Statistics for The Behavioral Sciences (MindTap C...StatisticsISBN:9781305504912Author:Frederick J Gravetter, Larry B. WallnauPublisher:Cengage Learning
  Elementary Statistics: Picturing the World (7th E...StatisticsISBN:9780134683416Author:Ron Larson, Betsy FarberPublisher:PEARSON
 The Basic Practice of StatisticsStatisticsISBN:9781319042578Author:David S. Moore, William I. Notz, Michael A. FlignerPublisher:W. H. Freeman
 Introduction to the Practice of StatisticsStatisticsISBN:9781319013387Author:David S. Moore, George P. McCabe, Bruce A. CraigPublisher:W. H. Freeman
MATLAB: An Introduction with Applications
Statistics
ISBN:9781119256830
Author:Amos Gilat
Publisher:John Wiley & Sons Inc
Probability and Statistics for Engineering and th...
Statistics
ISBN:9781305251809
Author:Jay L. Devore
Publisher:Cengage Learning
Statistics for The Behavioral Sciences (MindTap C...
Statistics
ISBN:9781305504912
Author:Frederick J Gravetter, Larry B. Wallnau
Publisher:Cengage Learning
Elementary Statistics: Picturing the World (7th E...
Statistics
ISBN:9780134683416
Author:Ron Larson, Betsy Farber
Publisher:PEARSON
The Basic Practice of Statistics
Statistics
ISBN:9781319042578
Author:David S. Moore, William I. Notz, Michael A. Fligner
Publisher:W. H. Freeman
Introduction to the Practice of Statistics
Statistics
ISBN:9781319013387
Author:David S. Moore, George P. McCabe, Bruce A. Craig
Publisher:W. H. Freeman