
ENGR.ECONOMIC ANALYSIS
14th Edition
ISBN: 9780190931919
Author: NEWNAN
Publisher: Oxford University Press
expand_more
expand_more
format_list_bulleted
Related questions
Question
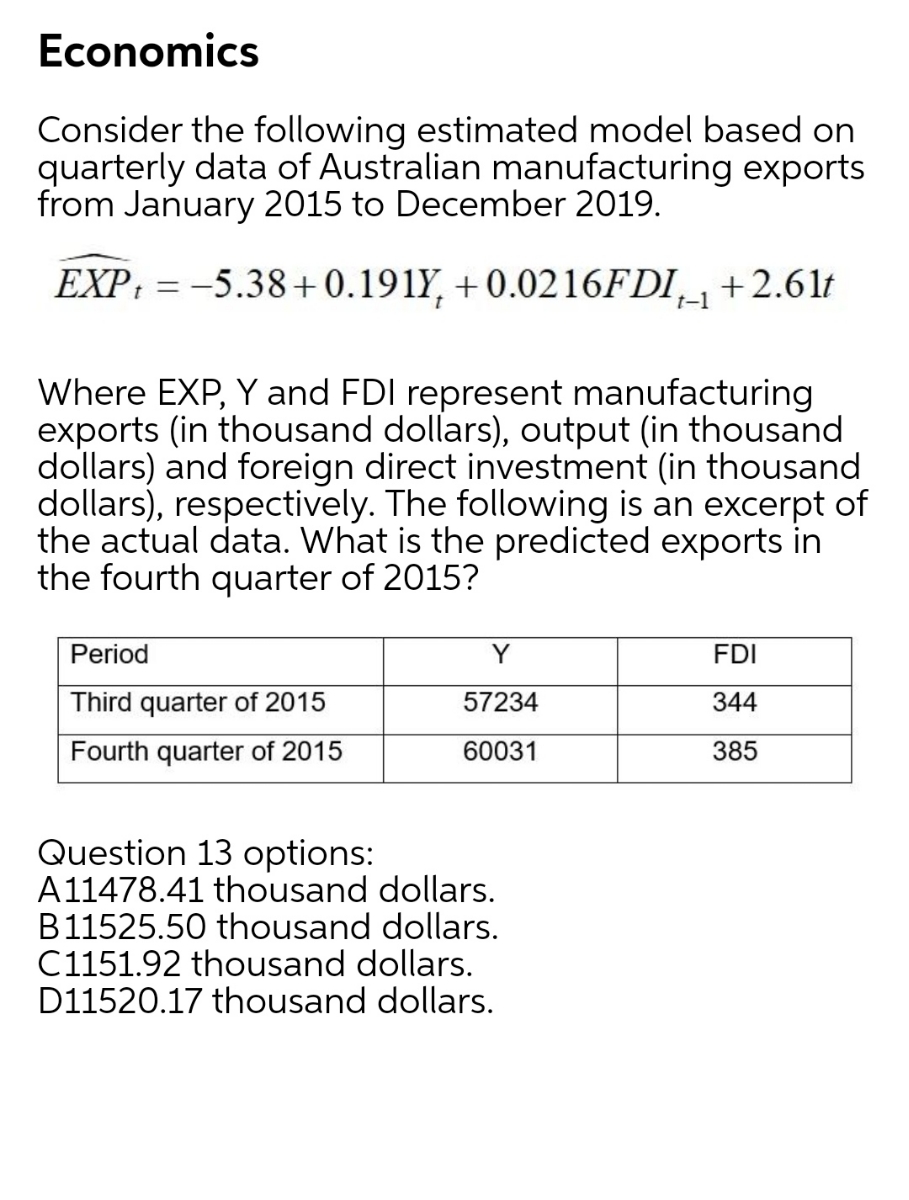

Transcribed Image Text:Economics
Consider the following estimated model based on
quarterly data of Australian manufacturing exports
from January 2015 to December 2019.
EXP: = -5.38+0.191Y, + 0.0216FDI_+2.61t
t-1
Where EXP, Y and FDI represent manufacturing
exports (in thousand dollars), output (in thousand
dollars) and foreign direct investment (in thousand
dollars), respectively. The following is an excerpt of
the actual data. What is the predicted exports in
the fourth quarter of 2015?
Period
Y
FDI
Third quarter of 2015
57234
344
Fourth quarter of 2015
60031
385
Question 13 options:
A11478.41 thousand dollars.
B11525.50 thousand dollars.
C1151.92 thousand dollars.
D11520.17 thousand dollars.
Expert Solution
This question has been solved!
Explore an expertly crafted, step-by-step solution for a thorough understanding of key concepts.

Step by stepSolved in 3 steps with 1 images

Knowledge Booster


Learn more about
Need a deep-dive on the concept behind this application? Look no further. Learn more about this topic, economics and related others by exploring similar questions and additional content below.Similar questions
- The U.S. government treats the goods produced by a firm in a year that are not sold in that year as increases in inventories and includes them in that year's GDP at market prices. In other words, the government assumes that the firm itself buys those goods for future resale. With that convention in mind, decide which of the following statements is correct. Ignore illegal goods and illegal activities altogether (Assume there are no illegal activities). The question has multiple correct answers. The value of any good produced domestically in a year will be included in that year's GDP. The value of any good produced domestically in a year will be included in that year's GDP, except those produced by households for their own consumption. The value of any good produced domestically and sold in a year will be included in that year's GDP. Illegal goods would change the answer to NO. The value of any good produced domestically and sold in a year will…arrow_forwardWhich of the following factors will affect the core PCE (Personal Consumption Expenditure) deflator? Select ALL that apply: Oprice of housing rents in American cities salaries paid to domestic workers Opriced of crude oil produced in Oklahoma Oprice of fresh vegetables in grocery stores price of imported iPads manufactured in Indiaarrow_forwardCountry A produces GDP according to the following equation: GDP = 5√K. The country has a depreciation rate of 6.9%. What does this country's savings rate need to be in order to sustain a steady-state GDP of $142? Put your answer into percentage form (e.g. 30.57% not 0.3057) and then round to two decimal places. You do not need to include the % sign.arrow_forward
- I need help with this question pleasearrow_forwardThis case study focuses on the Australian economy in 2019, before the COVID-19 pandemic hit. On 4th September 2019, the Australian Bureau of Statistics (ABS) published Real GDP data for the quarter ending June 2019. (The reporting of GDP always lags by about 2 months as it takes time to collect and compile data). The data showed that the Australian economy recorded quarterly growth of 0.5%. However, there was a decrease in Real GDP per capita. Furthermore, Real GDP per capita in June 2019 was lower than it was a year before (June 2018). Overall, while Real GDP still increased, the growth was very weak; the weakest on record since March 2001. (Source: Australian Financial Review and The Guardian). Required: Question 1. Clearly explain what Real GDP per capita means.Clearly explain why Real GDP per capita decreased whereas there was still growth in Real GDP for the quarter ending June 2019. Question 2. Given the economic conditions described above, predict how the following key…arrow_forwardConsider the following numerical example of the IS-LM model: C = 207+0.45% /= 150+0.21Y-1,099/ G = 396 T= 317 /= 0.06 Derive the IS relation. (Hint: You want an equation with Y on the left side of the equation and everything else on the right.) Y=- (Round your calculations of the intercept and slope terms to two decimal places.)arrow_forward
- A certain country's GDP (total monetary value of all finished goods and services produced in that country) can be approximated by g(t) = 2,000-420e 0.07t billion dollars per year (0 ≤t≤ 5), where t is time in years since January 2010. Find an expression for the total GDP G(t) of sold goods in this country from January 2010 to time t. HINT: [Use the shortcuts.] G(t) = Estimate, to the nearest billion dollars, the country's total GDP from January 2010 through June 2014. (The actual value was 7,321 billion dollars.) Xbillion dollarsarrow_forwardConsider the basic Macroeconomic model involving: Private sector consumption: C = co+c1(Y-T); Y = GDP, T = Taxes Tax function: T = to+t1Y Business sector investment: I = io+i2r, r=interest rate Government spending: G = Go Exports: X = xo+x1x; x = Exchange rate of the dollar Imports: M = mo+m1Y+m2x; x = Exchange rate (a) Identify and explain the parameters: co, t1, i2, and m2. (b) Solve this model for the equilibrium GDP (Y*).arrow_forwardCa=25+0.75 (Y-T) lg = 50 Xn=10 G = 70 T= 30 (Advanced analysis) The accompanying equations are for a mixed open economy. The letters Y, Calg Xn, G, and T stand for GDP, consumption, gross Investment, net exports, government purchases, and net taxes, respectively. Figures are in billions of dollars. The equilibrium level of GDP for this economy isarrow_forward
- Show full answers to the questions and steps to this exercisearrow_forwardIn this question, In Country 1, the values of the aggregate variables in 2020 are given as follows: Country 1 (in 2022) Variable Value Consumption 1227 investments 800 Government expenditures: 500 Exports: 150 Imports: 550 What is the GDP of Country 1 in 2022? Only Typing answer I need ASAParrow_forwardWe have obtained the following information about Real GDP in the U.S. economy from 1973:01 through 1975:Q++Data has been provided by the Bureau of Economic Analysis (BEA): Real GDP (billions of chained 2012 $) $5,646.3 $5,707.8 $5,677.7 $5,731.6 $5,682.4 $5,695.9 $5,642.0 $5,620.1 $5,551.7 $5,591.4 $5,687.1 $5,763.7 Year 1973 1974 1975 Quarter Q1 Q2 Q3 Q4 Q1 Q2 Q3 Q4 Q1 Q2 Q3 Q4 A. Create a graph of the above Real GDP data and label the phases of the Business Cycle (Peak, Trough, Recession, Recovery/Expansion). B. In what quarter did the U.S. economy reach a business cycle peak? C. In what quarter did the U.S. economy reach the trough of the business cycle? D. What was the percent decline in Real GDP from the business cycle peak to the trough? RGDP trough - RGDP peak Hint: Economic Growth Rate = x 100 RGDP peakarrow_forward
arrow_back_ios
SEE MORE QUESTIONS
arrow_forward_ios
Recommended textbooks for you
 Principles of Economics (12th Edition)EconomicsISBN:9780134078779Author:Karl E. Case, Ray C. Fair, Sharon E. OsterPublisher:PEARSON
 Engineering Economy (17th Edition)EconomicsISBN:9780134870069Author:William G. Sullivan, Elin M. Wicks, C. Patrick KoellingPublisher:PEARSON
 Principles of Economics (MindTap Course List)EconomicsISBN:9781305585126Author:N. Gregory MankiwPublisher:Cengage Learning
 Managerial Economics: A Problem Solving ApproachEconomicsISBN:9781337106665Author:Luke M. Froeb, Brian T. McCann, Michael R. Ward, Mike ShorPublisher:Cengage Learning
 Managerial Economics & Business Strategy (Mcgraw-...EconomicsISBN:9781259290619Author:Michael Baye, Jeff PrincePublisher:McGraw-Hill Education
Principles of Economics (12th Edition)
Economics
ISBN:9780134078779
Author:Karl E. Case, Ray C. Fair, Sharon E. Oster
Publisher:PEARSON
Engineering Economy (17th Edition)
Economics
ISBN:9780134870069
Author:William G. Sullivan, Elin M. Wicks, C. Patrick Koelling
Publisher:PEARSON
Principles of Economics (MindTap Course List)
Economics
ISBN:9781305585126
Author:N. Gregory Mankiw
Publisher:Cengage Learning
Managerial Economics: A Problem Solving Approach
Economics
ISBN:9781337106665
Author:Luke M. Froeb, Brian T. McCann, Michael R. Ward, Mike Shor
Publisher:Cengage Learning
Managerial Economics & Business Strategy (Mcgraw-...
Economics
ISBN:9781259290619
Author:Michael Baye, Jeff Prince
Publisher:McGraw-Hill Education