
ENGR.ECONOMIC ANALYSIS
14th Edition
ISBN: 9780190931919
Author: NEWNAN
Publisher: Oxford University Press
expand_more
expand_more
format_list_bulleted
Related questions
Question
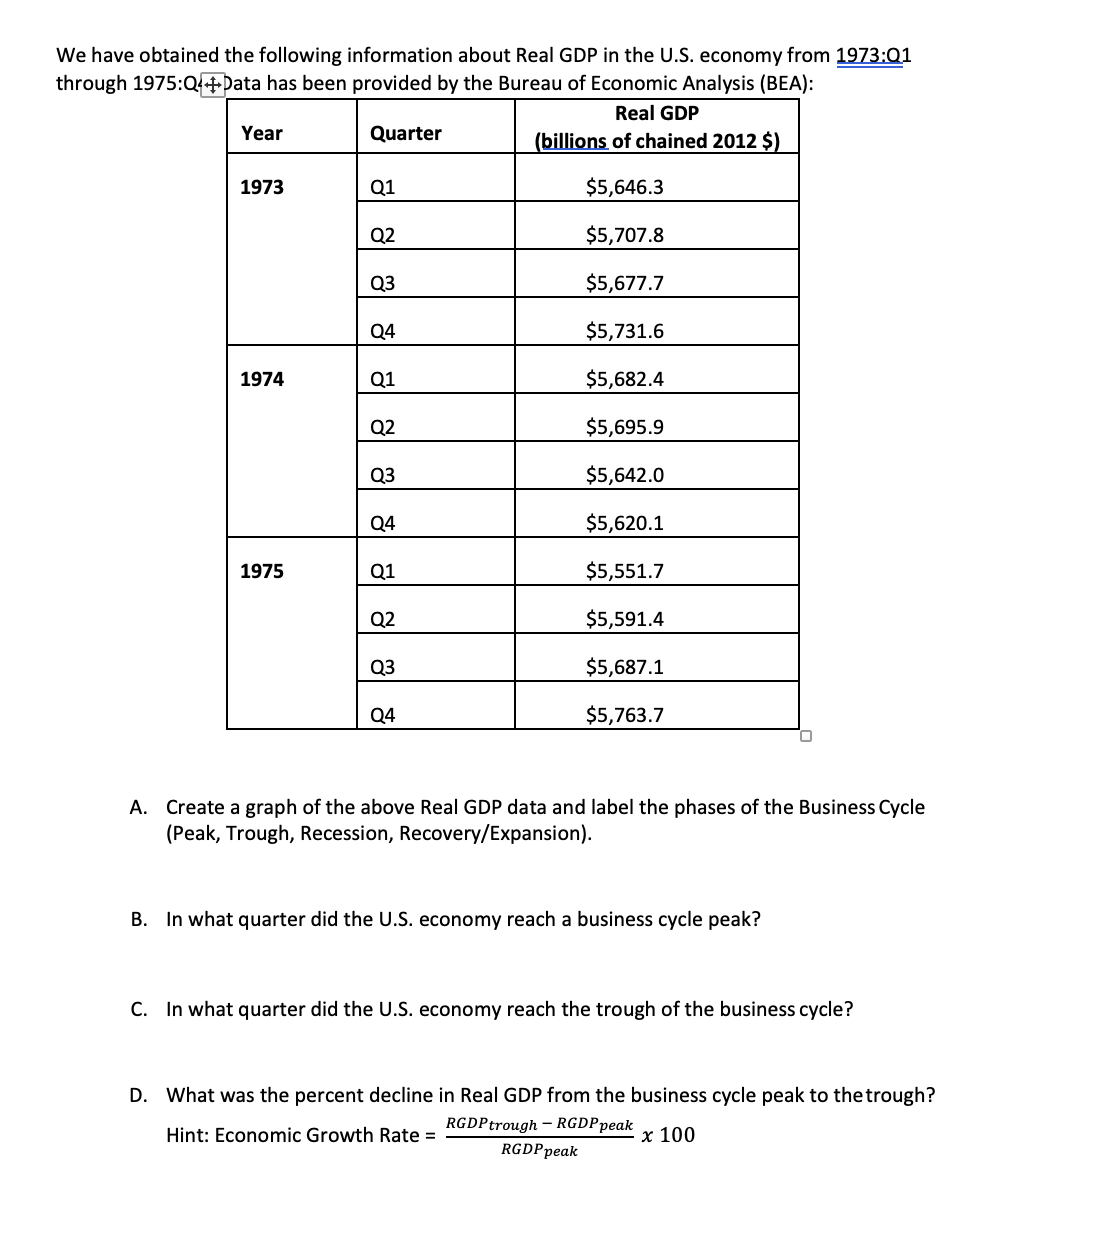

Transcribed Image Text:We have obtained the following information about Real GDP in the U.S. economy from 1973:01
through 1975:Q++Data has been provided by the Bureau of Economic Analysis (BEA):
Real GDP
(billions of chained 2012 $)
$5,646.3
$5,707.8
$5,677.7
$5,731.6
$5,682.4
$5,695.9
$5,642.0
$5,620.1
$5,551.7
$5,591.4
$5,687.1
$5,763.7
Year
1973
1974
1975
Quarter
Q1
Q2
Q3
Q4
Q1
Q2
Q3
Q4
Q1
Q2
Q3
Q4
A. Create a graph of the above Real GDP data and label the phases of the Business Cycle
(Peak, Trough, Recession, Recovery/Expansion).
B. In what quarter did the U.S. economy reach a business cycle peak?
C. In what quarter did the U.S. economy reach the trough of the business cycle?
D. What was the percent decline in Real GDP from the business cycle peak to the trough?
RGDP trough - RGDP peak
Hint: Economic Growth Rate =
x 100
RGDP peak
Expert Solution
This question has been solved!
Explore an expertly crafted, step-by-step solution for a thorough understanding of key concepts.

This is a popular solution

Trending nowThis is a popular solution!

Step by stepSolved in 4 steps with 3 images

Knowledge Booster


Learn more about
Need a deep-dive on the concept behind this application? Look no further. Learn more about this topic, economics and related others by exploring similar questions and additional content below.Similar questions
- The seasonally adjusted data below depict the performance of the economy of the United States in 1949. Year/Quarter 1949/Q1 1949/Q2 1949/Q3 1949/Q4 Select one: OA. Recession and disinflation. Annual Percent Change Nominal GDP -7.4 -5.2 +2.3 -3.3 Which of the following describes the performance of the economy of the United States in 1949? OB. Expansion and disinflation. OC. Expansion and deflation. OD. Recession and deflation. Annual Percent Change Real GDP -5.4 -1.4 +4.2 -3.3arrow_forwardActual and Potential GDP (a FRED question): Using the FRED database, locate the Congressional Budget Office’s measure of potential GDP by searching for ”GDPPOT”. Using the ”Add Data Series” option, add the series ”Real Gross Domestic Product (GDP1)” to this graph. Adjust the sliders to show the data from around 1985 to the present. (1) Display the graph. (2) Download a graph of the ”investment share of GDP” (for gross private domestic invest- ment) and display those data graphically since 1990. (3) How does this second graph help you understand the first graph in terms of the data since the Great Recession? Note:- Do not provide handwritten solution. Maintain accuracy and quality in your answer. Take care of plagiarism. Answer completely. You will get up vote for sure.arrow_forwardJust answer the chart and the questions provided in the picture (Base (Base Yr Yr =2020) Nominal Rasi (1) (3) (4) Total Production с Xa Aggregate Expenditures (Real GDP) C++X 14.0 Column (5) below represents aggregate expenditures (AE-C+1₂+G=X) for an economy when there is no government spending or taxing (G-T-50) and Real GDP-PI-DI (5) (6) Aggregate (8) (7) After-tax Consumption Aggregate Expenditures Caft Caft+I+X+G Expenditures $100 $100 $80 $0 $180 $ $200 $160 $ 80 $0 $240 S C+1₂+X+G $ S $300 $220 $ $ $ 80 $0 $300 $ $400 $280 $ $ $ 80 SO $360 $ $500 $340 $ 80 $0 $420 $ $ $ $600 $400 $ 80 $ 0 $480 $ S $ $700 $460 $ 80 $0 $540 $ S S i. What is the equilibrium level of GDP (where TP-AE) with no government spending or taxing? Suppose the government now spends $80 billion at each level of GDP and taxes remain at zero. Now fill in the new AE in column (6) above. ii. What is equilibrium GDP (where TP=AE) with this level of government spending? iii. MPS- Calculate the marginal propensities…arrow_forward
- Determine which expenditure(s) are included in the 2023 Gross Domestic Product (GDP) of Harrisonville. Correct Answer(s) Drag appropriate answer(s) here $500 million in road construction by state governments of Harrisonville Press Space to open $900 million in pharmaceutical products exported from Harrisonville to Murrayville Press Space to open a home built in 1974 valued at $ 750,000 Press Space to open businesses purchase $500 million on equipment and materials to produce future output Press Space to open $80 million in Social Security payments from the government to individuals Press Space to open $250 million expenditure for coffee beans from the central highlands of Peru Press Space to open $300 million in food and clothing purchases.arrow_forward# Calculate MPC when it is given that the value of MPS Is 0.66arrow_forwardFrom the press release of the statistics of Retail Sales for January 2021, a government spokesman said that, “The figure for January was conceivably distorted by the difference in timing of the Lunar New Year, which fell in mid-February this year but late January last year.” Explain the rationale of this statement. Is the year-on-year percentage change of retail sales for January 2021 expected to be higher or lower than usual?arrow_forward
- Your research into a nation has yielded the following Information: Autonomous expenditure (A) = $300 Gross Investment (1) = $200 Government purchases (G) = $300 Net exports (NX) = $225 Taxes (T) = $300 MPC=0.75 Instructions: If you are entering any negative numbers be sure to include a negative sign (-) in front of those numbers. a. Substitute the values above into the equation: AE=A+ [MPC × (Y-T)] +1+G+NX to determine the abbreviated equation for aggregate expenditures (AE). AE= Y b. Knowing that AE - Y at the equilibrium level of output, what is the equilibrium level of output for this nation? Ye: $ c. What is the tax multiplier for this economy? d. If taxes decrease by $40, from $300 to $260, what is the new equilibrium level of output? Ye: $ e. With this new tax level of $260, the government will O have enough tax revenue to pay for all its imports. O collect more in taxes than it spends on government purchases. O not tax businesses enough. • spend more on government purchases than…arrow_forwardWhich of the following factors will affect the core PCE (Personal Consumption Expenditure) deflator? Select ALL that apply: Oprice of housing rents in American cities salaries paid to domestic workers Opriced of crude oil produced in Oklahoma Oprice of fresh vegetables in grocery stores price of imported iPads manufactured in Indiaarrow_forwardConsider an economy that produces and consumes only three goods. The following table shows the prices and quantities of each good consumed in 2006, 2007, and 2008. Year 2006 2007 2008 Price of Fish $17 18 19 a) $9,000 b) $10,456 c) $8,264 What is the real GDP for 2008 using the chain-weighted method? Use 2007 as the reference year. d) $9,329 Quantity Price of Quantity of Price of Quantity of of Fish Pork Pork Beef Beef $18 225 17 17 250 16 275 e) $11,346 400 550 900 $110 112 115 27 27arrow_forward
- Real-Time Data Analysis Exercise The following table contains income and consumption data from FRED* for the fourth quarter of 2020. *Real-time data provided by Federal Reserve Economic Data (FRED), Federal Reserve Bank of Saint Louis. Title Value Personal Income $19.504.419 billion Disposable Personal Income $17.268.294 billion Personal Consumption Expenditures $14,542.383 billion Since personal consumption expenditures are exceeded by disposable income, the implication is that the fourth quarter of 2020 saw households engaged in saving investment botharrow_forwardThe following table shows data on personal consumption expenditures, gross private domestic investment, exports, imports, and government consumption expenditures and gross investment for the United States in 2007, as published by the Bureau of Economic Analysis. All figures are in billions of dollars. Fill in the missing cells in the following table to calculate GDP. Components Personal Consumption Expenditures (CC) $9,734.2 Gross Private Domestic Investment (II) $2,125.4 Exports (XX) $1,643 Imports (MM) $2,351 Net exports of goods and services (X−MX−M) Government Consumption Expenditures and Gross Investment (GG) $2,689.8 Gross domestic product (GDP) This method of calculating GDP, which involves summing the , is called the approach.arrow_forwardPlease answer the questions provided on the image below.arrow_forward
arrow_back_ios
SEE MORE QUESTIONS
arrow_forward_ios
Recommended textbooks for you
 Principles of Economics (12th Edition)EconomicsISBN:9780134078779Author:Karl E. Case, Ray C. Fair, Sharon E. OsterPublisher:PEARSON
 Engineering Economy (17th Edition)EconomicsISBN:9780134870069Author:William G. Sullivan, Elin M. Wicks, C. Patrick KoellingPublisher:PEARSON
 Principles of Economics (MindTap Course List)EconomicsISBN:9781305585126Author:N. Gregory MankiwPublisher:Cengage Learning
 Managerial Economics: A Problem Solving ApproachEconomicsISBN:9781337106665Author:Luke M. Froeb, Brian T. McCann, Michael R. Ward, Mike ShorPublisher:Cengage Learning
 Managerial Economics & Business Strategy (Mcgraw-...EconomicsISBN:9781259290619Author:Michael Baye, Jeff PrincePublisher:McGraw-Hill Education
Principles of Economics (12th Edition)
Economics
ISBN:9780134078779
Author:Karl E. Case, Ray C. Fair, Sharon E. Oster
Publisher:PEARSON
Engineering Economy (17th Edition)
Economics
ISBN:9780134870069
Author:William G. Sullivan, Elin M. Wicks, C. Patrick Koelling
Publisher:PEARSON
Principles of Economics (MindTap Course List)
Economics
ISBN:9781305585126
Author:N. Gregory Mankiw
Publisher:Cengage Learning
Managerial Economics: A Problem Solving Approach
Economics
ISBN:9781337106665
Author:Luke M. Froeb, Brian T. McCann, Michael R. Ward, Mike Shor
Publisher:Cengage Learning
Managerial Economics & Business Strategy (Mcgraw-...
Economics
ISBN:9781259290619
Author:Michael Baye, Jeff Prince
Publisher:McGraw-Hill Education