MATLAB: An Introduction with Applications
6th Edition
ISBN: 9781119256830
Author: Amos Gilat
Publisher: John Wiley & Sons Inc
expand_more
expand_more
format_list_bulleted
Concept explainers
Question
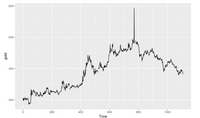
Does this graph have trends and/or seasonality?
What forecasting method is suitable for this data?

Transcribed Image Text:600 -
500 -
400 -
300 -
200
400
600
800
1000
Time
pjoß
Expert Solution
This question has been solved!
Explore an expertly crafted, step-by-step solution for a thorough understanding of key concepts.
Step by stepSolved in 2 steps

Knowledge Booster
Learn more about
Need a deep-dive on the concept behind this application? Look no further. Learn more about this topic, statistics and related others by exploring similar questions and additional content below.Similar questions
- Nhs prevetion programe was released to prvent type 2 diabetes, provide data on what year was it most effective and why, provide a graph alongside and a explanation to whyarrow_forwardI need help please soon as possiblearrow_forwardIf data set has a relationtionship that is best described by a linear model, then the residual plot willarrow_forward
- Canada's trade balance with the rest of the world has been steadily increasing over the past several years. It is well known that the U.S. is Canada's leading trade partner. Is there a predictable linear relationship between our total trade balance and our trade balance with the U.S.? Develop a regression model to predict the trade balance with the U.S. by our trade balance with the rest of the world. Comment on the strength of the model. Develop a time-series trend line for trade balance with the rest of the world by using the time periods given. Forecast total trade balance with the rest of the world for 2020 using this equation. Trade Balance ($ millions) Year Rest of the World U.S. 2010 2,290 4,991 2011 2,486 4,709 2012 2,776 4,641 2013 2,648 5,220 2014 3,068 5,041 2015 3,688 4,750 2016 4,111 4,321 2017 4,172 4,699 2018 3,669 4,777 2019 3,493 4,809 question 1: y̅ = ?+?x question…arrow_forwardSolve task from imagearrow_forwardHow do I graph this?arrow_forward
- Ordinal data cannot be analyzed using regression analysis. True Falsearrow_forwardWhen should a regression model not be used to make a prediction?arrow_forwardAssuming equal effort (# of nets in the water has not changed and the fishing season dates have stayed the same) identify trends in the squid population you see in the data. Based on your textbook reading this week, speculate what processes or dynamics could produce the population trends seen in your data.arrow_forward
- Hello! Please analyse the table 3 and 4 in the image attached. the data is supposed to see if there is a relationship between the prevalence of obesity(table3) or life expectancy (table4) between males and females. thank you!arrow_forwardAn analyst must decide between two different forecasting techniques for weekly sales of roller blades: a linear trend equation and the naive approach. The linear trend equation is F+ = 122 +1.9t, and it was developed using data from periods 1 through 10. Based on data for periods 11 through 20 as shown in the table, which of these two methods has the greater accuracy if MAD and MSE are used? (Round your intermediate calculations and final answers to 2 decimal places.) t 11 12 13 14 15 16 17 18 19 20 Units Sold 143 149 152 145 155 152 154 159 159 162 Click here for the Excel Data File MAD (Naive) MAD (Linear) MSE (Naive) MSE (Linear))arrow_forwarda. Make the case with graphs and numbers that women are a growing presence in the U.S. military. b. Make the case with graphs and numbers that women are a declining presence in the U.S. military. c. Write a paragraph that gives a balanced picture of the changing presence of women in the military using appropriate statistics to make your points. What additional data would be helpful?arrow_forward
arrow_back_ios
SEE MORE QUESTIONS
arrow_forward_ios
Recommended textbooks for you
 MATLAB: An Introduction with ApplicationsStatisticsISBN:9781119256830Author:Amos GilatPublisher:John Wiley & Sons Inc
 Probability and Statistics for Engineering and th...StatisticsISBN:9781305251809Author:Jay L. DevorePublisher:Cengage Learning
 Statistics for The Behavioral Sciences (MindTap C...StatisticsISBN:9781305504912Author:Frederick J Gravetter, Larry B. WallnauPublisher:Cengage Learning
 Elementary Statistics: Picturing the World (7th E...StatisticsISBN:9780134683416Author:Ron Larson, Betsy FarberPublisher:PEARSON
 The Basic Practice of StatisticsStatisticsISBN:9781319042578Author:David S. Moore, William I. Notz, Michael A. FlignerPublisher:W. H. Freeman
 Introduction to the Practice of StatisticsStatisticsISBN:9781319013387Author:David S. Moore, George P. McCabe, Bruce A. CraigPublisher:W. H. Freeman

MATLAB: An Introduction with Applications
Statistics
ISBN:9781119256830
Author:Amos Gilat
Publisher:John Wiley & Sons Inc

Probability and Statistics for Engineering and th...
Statistics
ISBN:9781305251809
Author:Jay L. Devore
Publisher:Cengage Learning

Statistics for The Behavioral Sciences (MindTap C...
Statistics
ISBN:9781305504912
Author:Frederick J Gravetter, Larry B. Wallnau
Publisher:Cengage Learning

Elementary Statistics: Picturing the World (7th E...
Statistics
ISBN:9780134683416
Author:Ron Larson, Betsy Farber
Publisher:PEARSON

The Basic Practice of Statistics
Statistics
ISBN:9781319042578
Author:David S. Moore, William I. Notz, Michael A. Fligner
Publisher:W. H. Freeman

Introduction to the Practice of Statistics
Statistics
ISBN:9781319013387
Author:David S. Moore, George P. McCabe, Bruce A. Craig
Publisher:W. H. Freeman